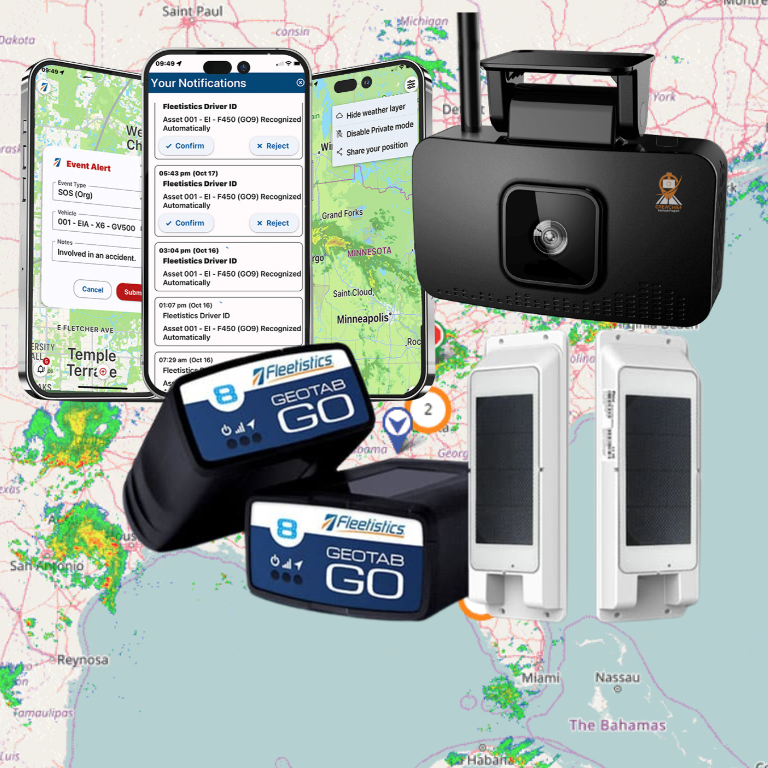


Fuel, maintenance, and labor costs rarely rise for one obvious reason. More often, small patterns, such as excess idling, overdue service, inefficient routes, or repeated driver exceptions, compound across hundreds of trips. The challenge is turning those patterns into decisions your team can act on.
Fleet analytics software combines telematics and operational data to show how vehicles, drivers, and assets are performing. Then helps you identify the actions most likely to reduce fuel use, prevent downtime, and control labor costs. It moves fleet management beyond collecting GPS points by connecting behavior, maintenance, utilization, and cost trends in one view.
Contact Fleetistics to see what your analytics can reveal about your costs.
That view becomes especially valuable when you connect performance data to compliance and operating procedures. For context, review Fleetistics’ Fleetistics Analytics, then start with the data your operation already collects and the costs you need to explain. The first step is defining what the software actually measures and how those signals become useful management decisions.
What Is Fleet Analytics Software?
Fleet analytics software is a web-based platform that brings your fleet data into one place, explains what it means, and helps you decide what to do next. Instead of reviewing disconnected GPS records, fuel receipts, maintenance notes, and driver reports, you can see patterns across vehicles, routes, equipment, and operating costs.
The distinction matters. Basic tracking can show where a vehicle is now or where it has been. Analytics adds context by turning that information into usable insight. You can identify a vehicle that idles more than comparable units, a route that consistently consumes extra fuel, or a maintenance issue that is becoming a downtime risk. The goal is not to collect more data. It is to use the right data to make better operating decisions.
Most fleet analytics platforms start with fleet telematics. The system receives information from GPS devices, vehicle diagnostics, sensors, electronic logs, driver apps, and connected business systems. It then organizes that information into dashboards, alerts, trends, and reports that your fleet team can act on.
How does the data become useful?
Analytics works by comparing actual performance with a meaningful baseline. You might compare idling time by vehicle class, fuel consumption by route, repair costs by asset age, or harsh-braking events by driver and shift. These comparisons help you focus on exceptions instead of treating every vehicle or driver as if they had the same operating conditions.
Telematics research has identified operating behaviors such as excessive speed, hard acceleration, hard braking, and excessive idling as useful areas for evaluating vehicle and driver efficiency. Those signals do not replace a manager’s judgment, but they give you specific events to review and coach. Research from Kansas State University describes using telematics and internal management data to analyze vehicle and driver performance.
What should you expect from a fleet analytics platform?
You should expect a clear path from signal to action. A useful platform helps you answer questions such as: Which assets need attention today? Where are costs rising? Which driver behaviors require coaching? Is a preventive maintenance schedule being followed? The answers should be visible to the people responsible for dispatch, safety, maintenance, and finance.
Fleetistics has provided GPS tracking, telematics, and fleet optimization solutions since 2001. For a broader view of how connected data supports compliance and daily fleet control, review this Fleetistics Analytics. The best implementation starts with the decisions you need to improve, then selects the data and workflows that support them.
Key Metrics Fleet Analytics Software Should Track
Useful reporting starts with the costs that move your fleet budget. Fleet analytics software should bring those measures into one view, then help you see which vehicles, routes, and operating habits need attention.
Start with fuel consumption at the vehicle and route level. Track fuel used, fuel cost, distance, and consumption trends over time. A rising fuel cost may reflect more than pump prices. Excessive idling, inefficient routing, unauthorized use, or changing vehicle conditions can all deserve investigation. For a deeper list of indicators, see Fleetistics’ guide to fleet analytics metrics. This article focuses on choosing and implementing the software that makes those metrics actionable.
Fuel, idle time, and utilization
Idle time belongs beside fuel consumption, not in a separate report. Compare idle minutes by vehicle, driver, location, shift, and season. Set a practical threshold for your operation, then flag exceptions instead of treating every idle event as equally wasteful. A truck waiting for a safe loading window may need a different response than a vehicle idling repeatedly between stops.
Utilization adds context. Review mileage, engine hours, trip frequency, and time in service against the asset’s role. These measures can expose underused equipment, overloaded units, or assignments that create avoidable travel.
Maintenance, repair, depreciation, and insurance
Fuel is visible, but it is only one part of the cost picture. Fleet cost analysis should include maintenance, repair, depreciation, and insurance, along with fuel and other applicable operating costs. Tracking these direct and indirect costs helps you compare the full cost of keeping an asset in service, not just its fuel bill.
Monitor preventive maintenance completion, overdue services, fault alerts, repair frequency, downtime, and cost per mile or engine hour. Research from Kansas State describes maintenance and operating history as important for reducing downtime and getting a stronger return when vehicles are replaced. The goal is not to generate more alerts. It is to identify the maintenance decisions that protect availability and vehicle life.
Driver behavior and operational exceptions
Measure speeding, hard braking, hard acceleration, seat belt events, and excessive idling where your equipment and policies support those signals. Telematics research from Kansas State identifies excessive speed, hard acceleration, hard braking, and excessive idling as behaviors worth reviewing when assessing vehicle and driver efficiency.
Finally, configure exception reporting around your own standards. A vehicle with high repair costs, fuel consumption, or operating costs should be compared with the thresholds that fit its duty cycle. Class, and environment, not only with an average from a different fleet. The Washington State Department of Enterprise Services specifically describes exception analysis against user-defined standards rather than averages of past data.
That distinction turns a dashboard into a management tool. You can assign a clear follow-up, whether that means coaching, a maintenance inspection, route review, or an asset replacement discussion.
How Does Fleet Analytics Software Cut Fuel, Maintenance, and Labor Costs?
Fleet costs rarely come from one oversized invoice. They accumulate through fuel consumed during unnecessary idling, repairs that become emergencies, vehicles that sit out of service, and labor hours lost to inefficient routes. Fleet analytics software helps you connect those operating costs to specific vehicles, routes, and behaviors so you can act before waste becomes the normal cost of doing business.
Where can you find fuel savings?
Start with consumption by vehicle, route, driver, and time period. A useful system should help you identify excessive idling, unusual fuel use, and route patterns that add miles without adding productive work. You can then coach the driver, adjust dispatch rules, or redesign the route instead of applying a fleet-wide guess.
This approach also makes fuel improvements measurable. Compare baseline fuel use with results after an idling policy, route change, or driver coaching session. Fleetistics cites a documented example from the City of Seattle, where analytics and utilization analysis supported approximately $2 million in fuel savings across a 4,100-vehicle fleet. Your results will depend on fleet size, routes, fuel prices, and execution. But the operating principle is transferable: find the avoidable consumption, assign an action, and measure the change.
For a deeper look at the tactics, see how telematics can help cut fuel waste. You can also estimate your fleet savings using your own vehicle count and cost assumptions.
How does analytics reduce maintenance and downtime?
Maintenance savings come from replacing calendar-only decisions with evidence. Track engine diagnostics, service intervals, repair history, mileage, and utilization together. That gives you a clearer basis for preventive maintenance and helps your team identify high-cost units before a minor issue creates a roadside failure or extended shop visit.
Fleet cost analysis should include more than the repair invoice. The Washington State fleet guidance identifies fuel, maintenance, repair, depreciation, and insurance as direct and indirect operating costs. It also recommends exception analysis, comparing units with high costs or fuel consumption against user-defined standards rather than relying only on historical averages. Review the fleet cost analysis guidance when defining those thresholds.
That visibility supports better replacement decisions, too. Research using telematics and fleet-management data notes that understanding how vehicles are operated and maintained helps reduce downtime and improve return on investment when vehicles are replaced. The goal is not to maintain every unit identically. It is to match maintenance attention and replacement timing to actual operating risk.
What labor costs can you control?
Labor productivity improves when dispatchers and supervisors can see the conditions behind missed appointments, excess miles, and long idle periods. Route performance data can reveal where schedules are unrealistic, where a territory needs redesign, or where a driver is spending time outside productive work. Driver behavior data can also highlight excessive speed, hard acceleration, hard braking, and idling for focused coaching rather than blanket criticism. Academic fleet research describes using telematics data and statistical methods to analyze vehicle and driver efficiency.
Safety belongs in the same cost conversation. Video-based driver monitoring and other safety technologies should be evaluated against equipment costs and potential crash-cost savings, not treated as an unmeasured add-on. When you connect fuel, maintenance, labor, and safety data, you can prioritize the changes with the strongest operating case and verify whether they deliver.
Custom Dashboards vs Standard Reports: What Do Fleet Managers Actually Need?
Standard reports give you a useful starting point. They summarize fuel use, mileage, maintenance activity, driver behavior, and other common measures in a consistent format. That consistency helps when you need a recurring monthly report or a shared baseline across departments.
The limitation is that a standard report usually treats every vehicle and manager the same. Your operating standards may be different for a refrigerated truck, a service van, and a heavy-duty work vehicle. A static average can show that costs are rising without showing which unit is outside the range you consider acceptable, or what deserves attention first.
Custom dashboards make the information operational. With fleet analytics software, you can organize data around the decisions you actually make. A maintenance manager may need overdue service and repair trends. An operations leader may need route performance, utilization, and idle time. A safety manager may need hard braking, speeding, seat belt events, and driver coaching priorities.
| Decision factor | Standard Reports | Custom Dashboards |
|---|---|---|
| Setup time | Fast to deploy using preset templates | Requires configuration around your roles and standards |
| Insight depth | Broad summaries and historical averages | Focused views with trends, thresholds, and relevant context |
| Exception alerts | May require manual review after delivery | Highlights exceptions when performance crosses your limits |
| Who it serves | General audiences and recurring reporting | Specific roles, locations, vehicle groups, or programs |
| Decision speed | Slower when users must filter and interpret the data | Faster because priorities are visible at a glance |
The difference matters most when you are managing by exception. Washington State fleet guidance describes exception analysis as identifying units with high operating, maintenance, repair, or fuel costs against user-defined standards, rather than relying only on historical averages. That approach gives you a more meaningful question: which vehicle is outside its expected range, and why?
Your dashboard should therefore show more than a red or green status. It should help you move from an exception to an action. Link a high-idle event to the relevant vehicle and route. Connect an overdue service alert to mileage and work-order history. Give each manager a view that answers the next question without requiring a spreadsheet export.
Start with the decisions that cost you the most time or money. Then configure role-based views, thresholds, and alerts around those decisions. Explore fleet management portal features to see how a focused portal can turn fleet data into a faster daily workflow.
Fleetistics Analytics: What Can You Measure From Day One?
You do not need months of data cleanup before you can act. Fleetistics helps you turn information from vehicles, equipment, drivers, and operations into practical decisions from the start. The goal is not to give you another screen to watch. It is to show you where performance is changing, which assets need attention, and what action is most likely to improve results.
Real-time diagnostics give you visibility into vehicle health as issues develop. You can monitor engine information, identify exceptions, and prioritize maintenance before a small problem becomes avoidable downtime. That makes your first conversations with a technician more specific and your maintenance planning more deliberate.
Driver performance is another early source of insight. Fleetistics analytics can help you review behaviors such as speeding, harsh braking, acceleration, and idling, then use those patterns for targeted driver coaching. You can focus on the behaviors that affect safety, fuel use, and vehicle wear instead of giving every driver the same generic reminder.
Over time, predictive maintenance and fuel-efficiency modeling help you move beyond reacting to events. You can compare trends across vehicles, routes, and operating conditions to identify recurring costs. If one unit consistently consumes more fuel or generates more maintenance activity than comparable assets, the data gives you a starting point for investigation.
This is where fleet analytics software becomes more useful than isolated spreadsheets. Fleetistics supports more than 300 integrations and provides a free API, so information from other business systems does not have to remain trapped in separate silos. You can connect the operational picture with the systems your team already relies on, while keeping the analysis focused on decisions that matter to your fleet.
Your implementation also comes with an experienced advocate. Fleetistics has served fleets since 2001 and maintains a more than 20-year relationship as a Geotab Gold Reseller. That means you have a consultative partner helping you evaluate the right combination of tracking. Diagnostics, safety, maintenance, and reporting tools, rather than being left to interpret a manufacturer’s platform alone.
Start with the questions that affect your operation today: Which vehicles are costing more than expected? Where is idling increasing? Which maintenance events threaten uptime? Which driver behaviors deserve coaching? The answers create a practical baseline, and that baseline can become a more complete operating model as your data grows.
Contact Fleetistics to see what your analytics can reveal.
Frequently Asked Questions
What is fleet analytics software?
Fleet analytics software turns telematics and operational data into usable insight about vehicles, drivers, routes, fuel, and maintenance. Instead of reviewing disconnected records, you can see patterns, compare performance, and prioritize the cost or safety issues that need action.
How does fleet analytics work?
The platform collects data from vehicle systems, GPS devices, fuel records, maintenance systems, and other integrations. It then organizes the information into dashboards, trends, alerts, and exception reports so you can compare actual performance with standards you define for your fleet.
How can fleet analytics reduce fuel costs?
Start by monitoring fuel consumption, excessive idling, route efficiency, and driving behaviors such as hard acceleration or speeding. These patterns help you coach specific drivers, adjust routes, and investigate unusual fuel use instead of applying the same solution to every vehicle.
Can fleet analytics improve maintenance and labor costs?
Yes. Maintenance data can help you schedule service before avoidable failures create downtime, while exception reporting can highlight units with unusually high operating, maintenance, or repair costs. That gives managers a focused list to investigate and reduces time spent sorting through records manually.
Does fleet analytics improve driver safety?
It can support safer operations by identifying risky behaviors and showing where targeted coaching is needed. Telematics research has examined indicators such as excessive speed, hard braking, hard acceleration, idling, and seat belt use as part of evaluating driver and vehicle performance (Kansas State University research).
Ready to See Fleet Analytics Software in Action?
A consultative walkthrough can help you connect fleet data to practical opportunities in fuel, maintenance, and labor management. You can review which metrics matter most for your operation and identify a sensible starting point.
Contact us to book a demo or speak with a consultant about your fleet analytics goals.