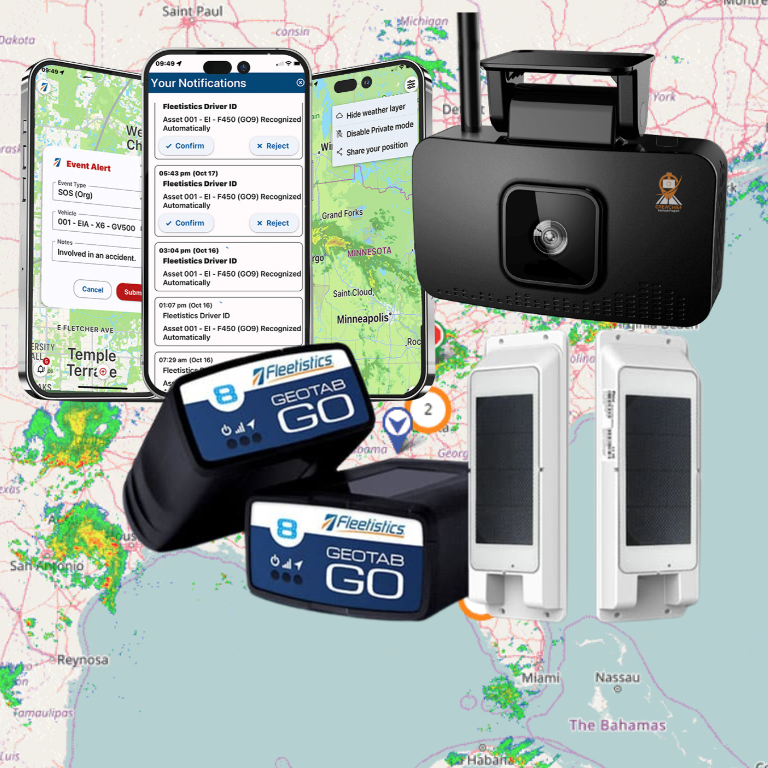


Fleet data reveals patterns that can guide maintenance, utilization, safety, and cost decisions.
Predictive analytics fleet management applies historical and near-real-time data to estimate what may happen, then supports decisions about maintenance, utilization, safety, and cost. It is decision support, not a guarantee: a forecast can prioritize review, but people still need to verify the condition, context, and appropriate response. Predictive workflows then support real-time review of vehicle and operating conditions.
Discuss your fleet needs with Fleetistics
How Predictive Analytics in Fleet Management Turns Data Into Decisions
Predictive analytics uses historical and current data with models to estimate what may happen next. In fleet operations, that estimate is useful only when it helps someone choose an action, such as reviewing a vehicle, adjusting a schedule, or investigating a developing risk. This estimate is useful when it helps a fleet team review vehicle, route, or maintenance conditions in time to choose an appropriate action.
It helps to separate three types of analysis:
- Descriptive analytics explains what happened. Examples include completed trips, recorded mileage, idle time, or maintenance events.
- Diagnostic analytics investigates why it happened. A manager may compare operating conditions, fault data, route history, or maintenance records to identify contributing factors.
- Predictive analytics estimates what may happen next. A pattern in vehicle signals and prior events may indicate that a component deserves inspection or that a particular operating condition requires attention.
The distinction matters because a forecast is not a diagnosis, and neither one automatically determines the right response. Historical data supplies context and helps establish normal patterns. Real-time signals can then prompt a review when current conditions begin to depart from that baseline. The decision still depends on the vehicle, operating environment, maintenance policy, and the quality and completeness of the available data.
Uncertainty should remain visible. No forecast is completely accurate, and changing routes, weather, loads, drivers, equipment, or data quality can alter the result. Treat a predictive signal as decision support. Validate it, document the action taken, and compare the outcome with a representative baseline rather than assuming the model caused an improvement.
What Data Makes a Fleet Prediction Useful?
A prediction is only as useful as the data behind it. Start with consistent, relevant records collected over time, then connect those records to the operating conditions that shaped them. Missing maintenance entries, inconsistent vehicle identifiers, or long gaps in reporting can make a trend look stronger or weaker than it really is.
Historical maintenance data gives a model a reference point. Work orders, inspection findings, replaced parts, service dates, and recurring symptoms can help identify patterns in wear. Connect those records to operating conditions and verify them against inspection findings before setting a maintenance priority.
Diagnostic data adds another layer. Research from the Texas Department of Transportation explored using engine data collected through onboard diagnostic systems to recommend oil-change intervals. That does not mean every fleet can use the same interval or that an algorithm replaces inspection. It shows why the source, timing, and quality of a signal matter when building a maintenance workflow. Review the TxDOT study.
Telematics and vehicle-condition data can provide context around how an asset is being used. In one transit-bus pilot, near-real-time oil-quality data was combined with additional onboard telematics data for a predictive-maintenance algorithm. The example illustrates a practical principle: one signal rarely explains the full condition of a vehicle. See the transportation research example.
Operating context also changes the meaning of a signal. A highway-driven truck may experience steady loads, while a city truck with frequent braking and idling can wear components differently. That distinction matters when interpreting a fleet-maintenance pattern. A useful workflow therefore considers route type, duty cycle, weather or seasonal conditions when available, and the relevant time window instead of treating every vehicle as equivalent.
Finally, predictions need a decision path. Define which team reviews the signal, what evidence confirms it, and how the response is recorded. The goal is not to generate more alerts. It is to give fleet leaders a clearer basis for deciding what to inspect, schedule, monitor, or investigate next.
How Can Predictive Analytics Improve Fleet Maintenance?
A condition-based maintenance workflow starts with a signal, not an automatic repair order. Vehicle diagnostics, maintenance history, telematics, and, where available, near-real-time sensor data can indicate that an engine or component is behaving differently. The system then compares that pattern with defined thresholds or a predictive model and sends a prioritized alert for review.
1. Turn a signal into a maintenance decision
An alert should give a maintenance coordinator enough context to investigate. The review should identify the vehicle, what changed, how urgent the condition may be, and whether similar events have occurred before. Staff can verify the alert against inspection notes, driver observations, fault codes, mileage, operating conditions, and the vehicle’s service history. This human check helps separate a meaningful warning from a noisy or incomplete data point.
After verification, the team can schedule the appropriate inspection, part, technician, and downtime window before the issue becomes a roadside failure. Maintenance software can help organize those schedules, work orders, diagnostics, service records, and follow-up reporting. See this guide to fleet maintenance management software for the workflow details.
What does the evidence show?
One external example comes from a DOT-documented Ravenna predictive-maintenance pilot. Its algorithm predicted potential engine failures and alerted maintenance staff for corrective action. Compared with the pilot’s before period, the report recorded 8.08% fewer breakdowns per vehicle per 10,000 kilometers and 31.8% less oil required per vehicle per 10,000 kilometers. These are results from that specific pilot, not Fleetistics results or promises for every fleet. Read the DOT pilot summary.
The same example makes implementation effort visible. Average maintenance time per vehicle did not change, while data-management labor increased 17%, primarily because the supporting IT system required tuning during implementation. Models can also produce false positives or miss problems when data is sparse, sensors drift, vehicle use changes, or maintenance records are inconsistent. Start with a representative baseline, review alerts with maintenance staff, and measure observed outcomes before expanding the workflow.
How Can Fleet Analytics Improve Utilization and Cost Decisions?
Utilization analysis becomes useful when it connects vehicle activity to completed work, service commitments, and operating conditions. A fleet manager can review route history to see how routes actually unfolded, then compare planned work with completed stops, unproductive mileage, service-window performance, and exceptions. The goal is not to assume that every deviation is waste. A detour may reflect an urgent call, a customer delay, traffic, or a changing service requirement.
That context helps turn predictive analytics fleet management from a dashboard exercise into a decision process. Route optimization may be available as part of a platform, but its practical value depends on the quality of schedules, location data, constraints, and dispatcher review. Fleetistics lists dispatch, custom reporting, alerts, route history, and API access among relevant capabilities, while emphasizing that fit should be checked by plan. Review the options in fleet management analysis before assuming a specific workflow is included.
Which metrics clarify utilization?
Start with a representative baseline and compare equivalent periods and operating conditions. Useful measures can include mileage per completed stop, on-time performance within service windows, route completion, idle time, overtime, and dispatcher or driver adoption. These metrics answer different questions: whether work is being completed, whether schedules are realistic, how much time is unproductive, and whether the workflow is being used consistently.
Alerts can surface idling, missed milestones, or unusual activity for review, but an alert is not a cost diagnosis. Pair it with route history, job records, vehicle type, and local operating conditions. Highway and city use can produce very different braking and idling patterns, so comparisons should not combine unlike work without adjustment.
How should cost decisions be tested?
Measure modeled opportunities separately from observed results. Fleetistics does not establish a guaranteed route-mileage reduction or ROI figure, so use the baseline to test a defined change over an equivalent period. Confirm which reports, alerts, routing tools, and integrations are available for the selected fleet and software tier before setting the measurement plan.
How Can Predictive Workflows Support Fleet Safety?
Safety teams can use predictive workflows to turn scattered operating data into a repeatable review process. For transportation and logistics operators coordinating delivery and service routes, the goal is not to label a driver or vehicle as unsafe. It is to identify patterns that deserve context, discussion, and a measured response.
Start with trends, not isolated events
Review recurring indicators across comparable vehicles, routes, shifts, or time periods. Depending on the data available, a fleet team might examine repeated harsh-event patterns, near-miss reports, alerts, route conditions, or changes in driver adoption. A trend can prompt a closer review of road conditions, scheduling pressure, training needs, vehicle condition, or policy clarity.
Safety analytics also benefits from responsible data sharing. NHTSA’s PARTS partnership combines automaker-shared safety data with crash records for collaborative analysis. With the goal of gaining real-world insight into the safety benefits and opportunities of advanced driver assistance systems: NHTSA PARTS partnership.
Connect alerts to coaching and governance
An alert should lead to a defined workflow. A supervisor can verify the underlying event, speak with the employee, document the context, and choose a proportionate action such as coaching, route review, vehicle inspection, or policy reinforcement. Clear notice, access controls, retention rules, and consistent review criteria help employees understand how safety data is used.
Use fleet safety program metrics to track whether the process is being followed and whether conditions are changing. Suggested measures can include event frequency, completion of coaching, repeat-event rates, incident trends, and driver or dispatcher adoption. Treat these as evaluation measures, not guaranteed outcomes.
Keep the signal in perspective
A predictive signal does not prove causation, establish fault, or guarantee a safer outcome. It may reflect incomplete data, changing routes, weather, traffic, vehicle differences, or inconsistent reporting. Compare equivalent periods and operating conditions, investigate exceptions, and record what action followed each review. That discipline helps a fleet learn from patterns without mistaking a forecast for a diagnosis.
What Can Predictive Analytics Establish, and What Can It Not?
Predictive analytics can establish a data-supported likelihood or pattern. It cannot establish certainty, prove causation, or replace the operational decision that follows. A forecast is an input to review, not a promise about what will happen next.
| It can establish | It cannot establish on its own |
|---|---|
| A risk pattern based on historical and current data, such as conditions associated with a possible maintenance event. | That a component will fail at a specific time or that an alert is always correct. No future prediction is completely accurate. |
| A measured change between comparable periods when the baseline, operating conditions, and comparison method are documented. Fleetistics recommends distinguishing modeled savings from observed results. | That the predictive workflow caused every observed improvement, especially when routes, drivers, weather, loads, or maintenance practices also changed. |
| Which signals or metrics deserve investigation, such as idle time, overtime, route completion, or maintenance indicators. | A guaranteed reduction in route miles, costs, downtime, or ROI. Fleetistics does not establish a universal route-mileage or ROI figure. |
| Whether a selected workflow appears relevant to a fleet’s data and operating conditions. | That a particular alert, integration, report, or feature is included in every software tier. Feature availability must be checked for the selected fleet and plan. |
False positives still need review, while false negatives can leave a developing issue unseen. Changing conditions can also weaken a model’s usefulness over time. Treat the output as a prompt to verify the vehicle, route, work order, or operating pattern, then record what action was taken and what actually occurred.
Discuss your fleet needs with Fleetistics
How Should You Measure Results Before Scaling a Predictive Workflow?
Scaling should follow evidence, not enthusiasm. A useful test shows whether the workflow improves a defined operating decision, fits the fleet’s data and can be maintained without creating more administrative work than the team can absorb.
- Set a representative baseline. Choose a defined fleet group, operating period, and decision such as maintenance exceptions, route completion, or idle-time review. Record the starting measures before changing the workflow. Suggested KPIs include mileage per completed stop, on-time service-window performance, route completion, idle time, overtime, and dispatcher or driver adoption. Compare equivalent periods and operating conditions, and keep modeled savings separate from observed results.
- Run a bounded pilot. Test the workflow with enough vehicles, equipment, or routes to expose normal variation, but keep the scope manageable. Confirm that the required reporting, alerts, route history, dispatch, and API capabilities are available in the selected plan. Route optimization, maintenance management, and fuel monitoring may be relevant options, but they should not be assumed to exist in every tier. Review data quality and ownership at the same time. One transportation pilot reported a 17% increase in data-management labor during implementation, largely while its supporting IT system was tuned. That is a useful reminder to measure implementation effort as well as operational outcomes.
- Review decisions and exceptions. Ask whether the forecast led to a timely, appropriate action, not merely whether the dashboard generated a signal. Check false positives, missed events, adoption, integration reliability, and the time required to validate or override recommendations. A result that looks favorable in one operating environment may not transfer to a different mix of highway, city, seasonal, or service work.
- Scale in stages. Expand only when the baseline comparison, data-management workload, plan fit, and operational response are acceptable. An open ecosystem with free API access and more than 300 integrations can support broader data connections, while Geotab-supported technology, implementation guidance, and ongoing support can help teams configure a modular approach. Verify the selected features for your fleet and software tier before committing to a wider rollout.
Contact Fleetistics to discuss your fleet needs.
Frequently Asked Questions
What does predictive analytics mean in fleet management?
Predictive analytics uses historical and current fleet data with analytical models to estimate what may happen next. A forecast can help a manager prioritize maintenance, review utilization, or investigate a safety trend, but it supports a decision rather than replacing operational judgment.
Which KPIs should you track in a predictive fleet workflow?
Choose measures that connect to the decision being tested. Useful examples include mileage per completed stop, on-time service-window performance, route completion, idle time, overtime, maintenance events, and dispatcher or driver adoption. Establish a representative baseline first, then compare equivalent periods and operating conditions rather than treating a single result as proof of ROI.
Can predictive analytics eliminate unexpected vehicle breakdowns?
No. A model can identify a potential failure pattern and prompt inspection or scheduling, but it cannot establish that a failure will occur. Sensor gaps, changing operating conditions, incomplete maintenance records, false positives, and false negatives all affect the result. Maintenance staff still need to verify the signal and decide what action is appropriate.
What should you confirm before implementing a predictive workflow?
Confirm that the required telematics, diagnostic, maintenance, and operational data are available and consistently recorded. Define the decision, baseline, review period, and success metrics before launching a pilot. Also verify that the reporting, alert, integration, and API capabilities you need are included in the selected software tier, because feature availability varies by plan.
Contact us to plan your next step
Predictive analytics is most useful when it connects reliable data to practical decisions about maintenance, utilization, safety, and cost. A focused conversation can help you clarify the questions your fleet needs to answer. Identify the right reporting and diagnostic inputs, and choose an evaluation path that fits your operation.