
Most fleets do not have a shortage of data. They have a shortage of decision-ready priorities. A telematics platform may show location, idling, fuel use, trip history, vehicle faults, and driver behavior. Those signals create value when they lead to a clear owner, action, and measurable result.
Fleet management and analysis means turning connected-vehicle data into operational decisions. Examples include reducing avoidable idle time, correcting route waste, prioritizing maintenance, and coaching a specific safety behavior. The strongest approach starts with a baseline, focuses on exceptions that matter, assigns responsibility, and measures what changed.
That process depends on understanding what your data represents and which questions your fleet needs to answer first. Start by separating data collection from analysis and action.
Contact Us Today to discuss your fleet’s priorities and identify a practical starting point for turning telematics data into measurable decisions.
What Does Fleet Management and Analysis Actually Mean?
Fleet management and analysis turns information about vehicles, equipment, drivers, and routes into better operating decisions. It has three connected layers: data collection, analysis, and action. A tracking device may record location, engine activity, mileage, or driving events. Those records alone do not reduce fuel use, improve maintenance, or keep work on schedule. The value comes from interpreting the information in the context of your operation and assigning a practical response.
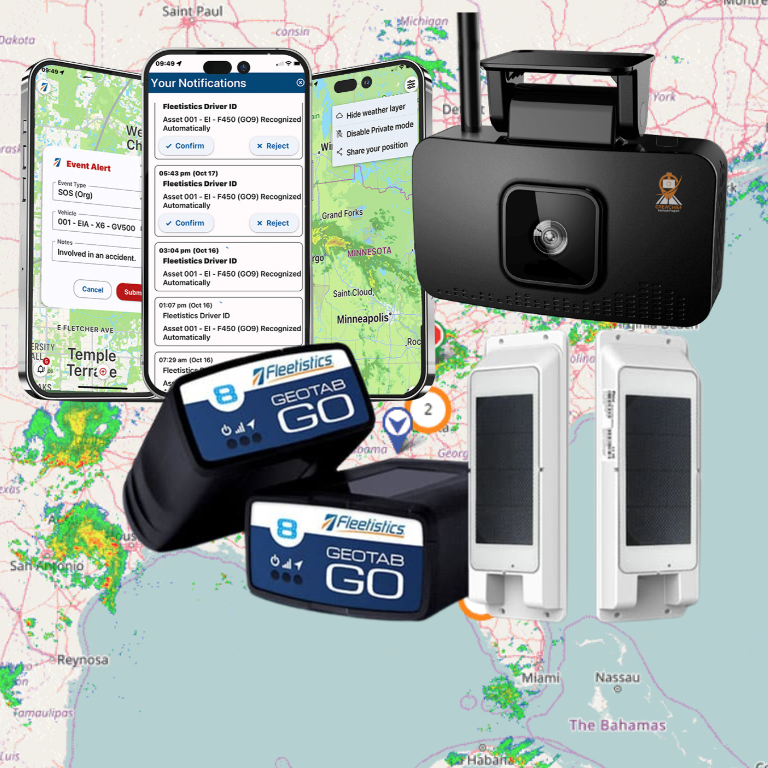
The first layer is visibility. GPS tracking and telematics can show where assets are, how they are being used, and what is happening while they are in service. That visibility can support decisions about unauthorized stops, dwell time, route performance, utilization, idle activity, and vehicle condition. Fleetistics combines hardware, software, telematics, analytics, routing, maintenance, compliance, and fuel-management capabilities. You can learn more about real-time fleet visibility.
The second layer is analysis. Establish a baseline, identify exceptions, and compare actual performance with the outcome you want. A manager might examine whether idle events are concentrated in one location, whether routes exceed planned mileage, or whether diagnostics suggest a maintenance issue. Analytics, reports, alerts, and dashboards help convert large volumes of data into patterns an operations team can understand.
The third layer is operational action. An alert matters only when someone knows what it means, who owns the response, and how the result will be measured. A route exception may lead to a dispatch review. A diagnostic alert may create a maintenance work order. A recurring safety event may prompt coaching or a policy review. Integrations can move information between fleet systems and dispatch, maintenance, fuel, accounting, or other business tools.
A platform should not simply collect more data. It should help your team decide which events deserve attention, connect them to a repeatable workflow, and report whether the change improved cost, productivity, safety, compliance, or service performance. The right configuration depends on fleet type, existing systems, priorities, and growth plans.
Which Fleet Metrics Should Drive Your Next Decision?
The right metric is the one that helps you decide what to do next. A dashboard full of locations, alerts, and engine data will not improve operations unless your team connects each signal to an owner, an action, and a measurable result.
Start with a baseline, then segment data by vehicle type, route, region, driver group, or operating duty. This prevents an average from hiding the assets that create the most waste. Fleet leaders should consider fuel spend, idle hours, miles per route, unauthorized stops, cost per mile, utilization, maintenance-related downtime, and payback period. Explore these fleet analytics metrics for additional measurement ideas.
| Metric | Question to ask | Action it can guide |
|---|---|---|
| Fuel spend | Where is fuel use rising faster than activity or mileage? | Investigate idling, route design, fueling anomalies, and vehicle condition. |
| Idle hours | Which assets run without productive movement? | Set an exception rule, coach the team, or adjust procedures. |
| Miles per route | Are actual miles higher than planned for similar work? | Review dispatching, route sequencing, and service territories. |
| Unauthorized stops | Where are unplanned stops affecting productivity? | Confirm the reason, improve accountability, or revise the route. |
| Cost per mile | What does each vehicle or route cost for comparable work? | Prioritize the highest-cost exceptions. |
| Utilization | Are vehicles and equipment used enough to justify capacity? | Reassign assets or reconsider acquisition timing. |
| Maintenance and uptime | Which assets lose productive time to faults or repairs? | Prioritize preventive work, diagnostics, or replacement decisions. |
| Payback period | How long will savings take to offset the investment? | Validate the business case with baseline and post-change results. |
Use thresholds to focus attention
Thresholds should reflect the work being performed. An idle threshold for a delivery van may be inappropriate for a utility truck powering equipment at a job site. A high-mileage route may be justified by customer coverage, while an unexpected increase on an established route deserves review.
Define a meaningful exception and assign responsibility for reviewing it. A fuel-spend alert without someone who can check transactions, vehicle condition, route changes, and operating context becomes noise. The same applies to maintenance alerts. Their value comes from connecting a signal to a work order and confirming whether uptime improves.
How Do You Turn Telematics Alerts Into an Operating Workflow?
An alert is useful when it leads to a consistent decision. Treat each exception as a small operating case: validate what happened, decide whether it matters, assign responsibility, take a proportionate action, and check whether the result improved.
- Set the baseline and define the exception. Start with a normal operating range for the vehicle, route, driver, or asset. Compare idle minutes by vehicle, shift, weather, and job type. For routes, compare actual miles, stops, and arrival times with the plan.
- Validate the event before assigning blame. Review location, time, vehicle status, schedule, and related signals. An unauthorized-use alert may reflect a service call or yard move. Confirm the facts and document why the case was closed or escalated.
- Prioritize by impact and risk. Address safety-critical conditions, likely breakdowns, suspected unauthorized use, and repeated fuel waste before low-impact reporting issues. Use route optimization practices to turn route patterns into better dispatch plans.
- Assign one owner and one next action. An alert should enter a queue with a named owner, due date, and resolution code. Send a recurring engine signal to inspection or maintenance. A dedicated maintenance planning process connects detection to a work order and service window.
- Measure the change and refine the rule. Review the same metric after the action. Did idle hours decline? Did route miles change? Was the maintenance issue resolved before downtime? Adjust rules that create false positives.
This workflow creates accountability without turning telematics into surveillance for its own sake. Share the purpose of the alert, apply standards consistently, and give employees a way to explain legitimate exceptions. Over time, useful alerts become operating controls while low-value notifications are redesigned.
How Can Fleet Management and Analysis Prove ROI?
ROI becomes credible when you connect a fleet initiative to a measurable baseline, a defined owner, and a consistent review process. Record current performance before changing driver coaching, routing, maintenance rules, or fuel controls. Useful measures include fuel spend, idle hours, miles per route, unauthorized stops, cost per mile, utilization, and maintenance-related downtime.
Choose one operational problem and run a focused pilot. A 60-day Solution Evaluation Process can give your team time to compare normal activity with results after a targeted change. Select representative vehicles, define the expected outcome, and document variables such as seasonal demand, route mix, fuel prices, or staffing changes.
Measure outcomes that connect to the income statement
If the goal is lower fuel waste, compare fuel spend and idle hours against miles completed. If the goal is better routing, examine miles per route, drive time, completed jobs, and on-time performance. For maintenance, track downtime, work-order completion, repeat repairs, and vehicle availability. Review data weekly during the pilot, then establish a monthly cadence once the process is stable.
Fleetistics cites savings of up to 14% on fuel as a reference point. Treat that figure as a planning benchmark, not a guarantee. Actual opportunity depends on fleet type, route density, vehicle condition, and how consistently managers act on findings. Fuel-management solutions can help organize relevant data.
Payback is the point at which verified savings and productivity gains offset the implementation investment. Calculate it from your own baseline and post-pilot results. As a Fleetistics proof point, the City of Seattle deployment involved 4,100 vehicles with documented fuel savings. That example demonstrates the value of measuring outcomes at scale. It does not predict results for every fleet.
What Should You Look for in an Open, Scalable Platform?
A strong platform should connect operational data, support useful questions, and move an exception to an accountable action. Evaluate architecture that supports your current fleet without limiting systems, workflows, or asset types you may add later.
Can it connect to systems you already use?
Ask whether the platform offers documented APIs, exports, webhooks, and practical integration support. These capabilities can connect fleet information with dispatch, maintenance, fuel, accounting, payroll, insurance, or ERP systems. Confirm who can access the data, how it can be exported, and how much history is retained. Fleet management integrations should simplify work rather than create another silo.
Can you add capabilities without buying more than you need?
Scalability includes functional flexibility, not only more vehicles. A small service fleet may start with location, utilization, and maintenance visibility. A mixed or growing fleet may later need routing, driver safety, fuel controls, asset tracking, compliance workflows, or advanced analytics. Look for modular options matched to fleet type, operating model, and budget. The right fleet management software supports near-term priorities and a credible growth plan.
Are reports and alerts useful to the people who act?
Custom dashboards, configurable rules, automated reporting, and role-based views matter when they help people make decisions. During a demonstration, ask how a manager identifies an exception, assigns follow-up, and verifies improvement. Look for thresholds, schedules, geofences, escalation options, and filters that reduce alert fatigue.
What implementation and support will you receive?
Evaluate data migration, device configuration, integration planning, training, security practices, and report refinement after launch. Fleetistics has served fleets since 2001 and is the longest-running Geotab partner in the United States. As a customer advocate and implementation partner, Fleetistics helps organizations evaluate technology and services that fit their operation. Customers do not purchase directly from Geotab through Fleetistics.
How Should Fleet Leaders Start Without Overhauling Everything?
Days 1-7: Choose the question and establish a baseline
Pick one problem that matters and can be measured. Ask how much avoidable idle time occurs on service routes, or focus on unauthorized stops, missed maintenance, route variance, utilization, or safety events. Record current performance before changing alerts or coaching. Keep the first dashboard narrow. A small set of trusted measurements is more useful than an attractive screen full of unrelated data.
Days 8-14: Configure alerts and assign ownership
Configure alerts around exceptions that require a decision. Define who reviews each alert, who acts, when it is due, and how the action is recorded. Explain what data is collected, why it supports safety or operational improvement, who can access it, and how it will be used. A written driver policy can help establish expectations and reduce confusion.
Days 15-30: Review weekly and decide whether to expand
Compare results with the baseline, investigate exceptions, and adjust noisy rules. If data is incomplete or an alert does not lead to action, fix the workflow before adding another use case. A 60-day Solution Evaluation Process is a practical reference. Smaller fleets may use a shorter evaluation, while complex operations may need the full evaluation period. Duration should match the question, data quality, operating cycle, and stakeholders.
Book a Demo to see how an open, scalable fleet platform can connect your metrics, alerts, integrations, and ROI review process.
Frequently Asked Questions
What does fleet management and analysis include?
It connects telematics data such as utilization, route performance, maintenance status, safety events, and exceptions to a business decision, accountable owner, and follow-up measurement.
How many fleet metrics should we track?
Start with the smallest set that answers your current business question. A practical scorecard may include cost per mile, utilization, idle hours, unauthorized stops, on-time performance, maintenance costs, and safety events.
How should we prioritize telematics alerts?
Rank alerts by operational impact, urgency, and the availability of a clear response. Assign each alert type to a person, action, and review cadence so notifications do not become background noise.
How can a fleet prove that analysis is producing ROI?
Establish a baseline before changing the process, then compare the same measures after implementation. Track the outcome tied to the use case, such as reduced idle time, fewer unauthorized miles, improved utilization, lower maintenance expense, or better on-time performance.
What makes a fleet platform open and scalable?
Look for documented APIs, data portability, useful integrations, modular capabilities, flexible reporting, and an expansion path that does not force a full replacement. Confirm implementation, governance, security, and support.
Ready to Turn Fleet Data Into Action?
A clearer view of your metrics can help you focus on the operational decisions that matter most, from reporting priorities to ROI measurement. Contact Us Today to discuss your fleet visibility goals and explore a tailored Solution Evaluation Process.