

Every unnecessary idle hour and missed service window leaves a mark on your operating margin. Fleet analytics makes those hidden losses visible before they become routine.
Fleet analytics metrics are measurable signals that show how vehicles, drivers, and workflows affect cost, safety, productivity, utilization, fuel use, and customer service. A focused scorecard should include cost per mile, fuel consumption, idle time, route efficiency, utilization, downtime, maintenance status, and harsh driving events. Pair those measures with on-time arrival and service completion rates, then compare trends by vehicle, driver, route, and team. That analysis shows where to coach risky behavior, reassign underused assets, improve routes, and schedule maintenance before breakdowns disrupt customers. The National Institutes of Health uses telematics data for fleet rightsizing, trip planning, and fuel efficiency, showing how clear metrics guide practical operating decisions.
That raises the first question: What are fleet analytics metrics? A clear definition separates useful operational signals from reports that only add noise. Once that line is clear, your team can choose measures tied to real business outcomes. The path begins with
What are fleet analytics metrics?
Fleet analytics metrics are measures that turn daily vehicle and driver activity into clear signs of fleet performance. They help operations directors see what is working, find costly gaps, and decide where to act. Common measures include fuel use, vehicle use, downtime, maintenance status, route performance, and driver behavior.
From raw data to useful metrics
Raw fleet data is a stream of separate events. A GPS device records a location, a fuel card logs a purchase, and a work order records a repair. These records show what happened, but they do not explain the wider pattern.
Analytics sorts and joins those records to create useful measures, trends, and alerts. For example, location data becomes route time or vehicle use. Fuel and engine data can reveal excess idling or a change in miles per gallon. This process turns isolated facts into fleet analytics metrics that support daily choices.
Why fleet metrics matter
A well-chosen metric connects activity to an operating goal. Cost per mile links spending with output, while downtime shows how often an asset cannot work. Safety measures can show repeat patterns that call for coaching. Maintenance trends can help teams plan service before a small issue disrupts a route.
Metrics also give teams a shared way to review results. Directors can compare vehicles, routes, locations, or time periods without relying on guesswork. The NIH fleet management program, for example, uses telematics data for rightsizing, trip planning, and fuel efficiency work.
Data sources behind the dashboard
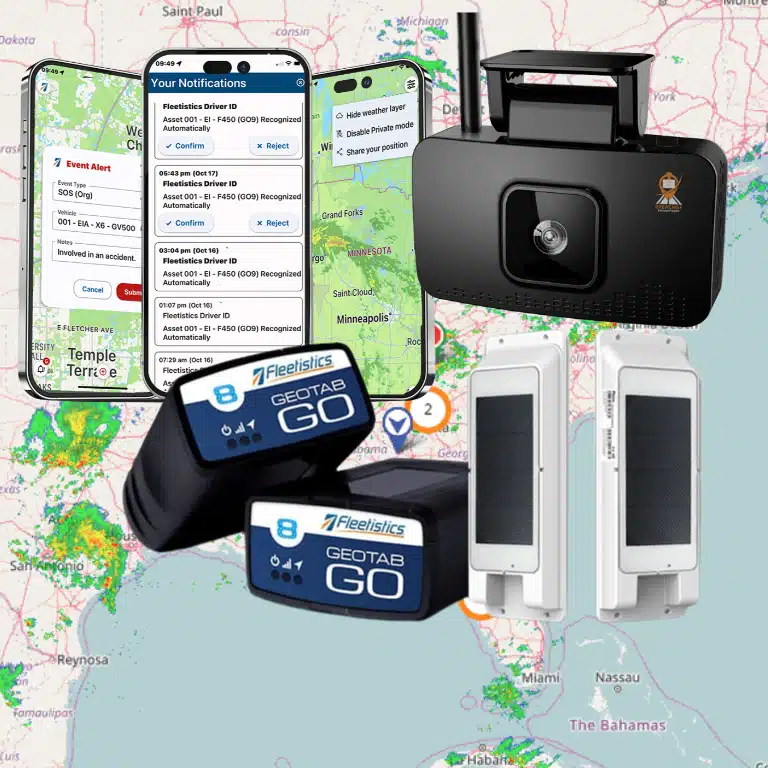
A useful dashboard brings several data sources into one view. Telematics and GPS systems provide location, speed, trip, engine, and idle data. Fuel records add purchase and consumption details. Maintenance systems add service dates, repair history, fault codes, and vehicle availability.
- Driver behavior: Harsh braking, rapid starts, speeding, seat belt use, and other safety events.
- Business workflows: Dispatch, payroll, customer service, inventory, and job completion records.
- External context: Road, traffic, and weather data that can explain route or service delays.
Integrations matter because no single source tells the full story. Joining vehicle activity with work results can show whether a route was both efficient and productive. A connected platform can also send alerts or reports into the tools teams already use. Fleetistics explains how a Geotab integration can help teams utilize fleet analytics metrics across safety, compliance, and cost workflows.
The best dashboard is not the one with the most charts. It is the one that shows a few trusted measures tied to clear goals. Start with the operating questions your team must answer, then choose the data needed for each answer. Fleetistics’ Fleet Management Solutions connect these data sources so teams can review results in context.
Cost and fuel metrics that expose waste
Cost and fuel data can reveal small leaks before they become a budget problem. The goal is not to watch every number each day. Instead, fleet managers should connect a few fleet analytics metrics to clear operating choices.
Cost per mile as a baseline
Cost per mile gives managers a common way to compare vehicles, routes, and teams. Calculate it with fuel, maintenance, lease, insurance, and other operating costs. Then compare similar vehicles doing similar work. A rising trend can point to poor fuel use, excess repairs, or a vehicle that no longer fits its job.
This metric becomes more useful when paired with miles driven and vehicle use. A low cost per mile can hide an asset that spends most of its time parked. Likewise, a busy vehicle may have a higher cost but still deliver better value. A sound review asks what each mile produced, not just what it cost.
Fuel, idle time, and unauthorized use
Fuel consumption should be tracked by vehicle, route, driver, and work type. This makes it easier to spot a sudden change and test its cause. The NIH fleet program calls for real-time fuel consumption tracking and the use of idle mitigation tools. Those practices show how fuel data can guide daily action.
- Fuel consumed per mile: Flags changes tied to routes, driving habits, loads, or vehicle condition.
- Idle time: Shows fuel burned while a vehicle is not completing a trip or service call.
- After-hours movement: Helps managers review possible unauthorized use and confirm valid exceptions.
- Fuel purchases versus location: Helps expose unusual transactions or gaps between fuel records and vehicle activity.
Do not treat one alert as proof of waste or misuse. Check the trip, driver schedule, weather, and work order first. A repeated pattern matters more than a single event. Teams that are tracking fleet analytics metrics can set fair baselines and focus reviews on real exceptions.
Routing efficiency and ROI decisions
Routing efficiency connects cost data to the work completed. Useful measures include miles per stop, drive time per job, repeat trips, and time spent outside planned service areas. Compare those measures by route type and day. This helps separate poor route plans from traffic, urgent calls, or other valid causes.
Managers can then rank actions by likely return. Reducing repeat trips may matter more than trimming a small amount of idle time. Reassigning an underused vehicle may beat replacing it. The right choice depends on the size, cause, and duration of each cost gap.
A Fleetistics consultant can help define practical baselines, review exceptions, and link each metric to an owner. This consultative approach keeps dashboards focused on choices rather than noise. Teams can Contact Us Today to map fuel and cost metrics to their operating goals.
Safety and driver behavior metrics operations directors should review
Behavior signals that need context
Safety data is most useful when leaders review patterns, not isolated alerts. The core fleet analytics metrics include harsh braking, speeding, seat belt use, distracted-driving alerts, and preventable incidents. Together, these measures show where daily driving habits create risk and where coaching can make a clear difference.
Start by viewing harsh braking and speeding as rates, not raw event totals. Normalize each measure by miles, trips, or driving hours so busy drivers are not unfairly ranked. Then split results by driver, team, vehicle type, route, and time of day. This view can reveal whether a pattern comes from one driver or a hard operating condition.
Seat belt use and distracted-driving alerts need similar context. Review repeated events, alert severity, and whether the same risk appears across several trips. AI dashcam signals can add useful context by showing the event before, during, and after an alert. A guide to using fleet analytics to monitor safety can help teams compare camera features and coverage.
These measures should lead to action, not a crowded scorecard. Set clear alert thresholds, check samples for false positives, and document how supervisors will respond. A consistent review process makes coaching fairer and keeps managers focused on behaviors they can change.
Coaching results and incident trends
Track incident rate alongside coaching completion and repeat-event rate. Incident rate shows the outcome, while coaching completion shows whether the planned response took place. Repeat-event rate then shows whether behavior changed after coaching. Review all three together because a completed coaching task is not proof that risk fell.
A useful coaching record notes the trigger, review date, coach, agreed action, and follow-up result. Compare results before and after coaching over a consistent period. Also watch for team-level trends. The same issue across many drivers may point to route pressure, poor vehicle fit, or an unclear policy.
Connections to cost, compliance, and trust
Driver behavior affects more than crash risk. Speeding and harsh braking can point to fuel waste and added wear. Distracted driving and seat belt gaps can raise incident exposure. Monitoring driver behavior matters because it affects fuel use and maintenance needs, as Fleetistics explains in its Fleet Management Solutions.
Link each safety metric to an operational measure that leaders already review. Compare harsh events with fuel use and repair records. Compare alerts and incidents with insurance claims, compliance findings, service complaints, and customer feedback. This creates a practical view of how driving habits affect cost, legal risk, and trust.
Telematics can support fleet rightsizing, trip planning, fuel savings, cost control, and regulatory goals. The National Institutes of Health fleet management program uses telematics for these aims. For operations directors, the lesson is simple: safety metrics should not sit in their own report. They become more useful when tied to maintenance, fuel, compliance, and customer outcomes.
Productivity, utilization, and customer service metrics to compare
From activity to useful capacity
Productivity metrics show how much work the fleet completes with the time and equipment available. Utilization shows whether each vehicle or asset earns its place in the operation. Together, these fleet analytics metrics help managers spot unused capacity, work delays, and service gaps.
Vehicle utilization compares active use with available time, while asset availability shows what is ready for dispatch. Downtime explains how often needed equipment cannot work. Managers can use these measures to adjust assignments, maintenance timing, or fleet size. The NIH fleet management program uses telematics data for fleet rightsizing and trip planning.
Metrics and actions to compare
No single metric gives a fair view of productivity. A high jobs-per-vehicle result may look good, but late arrivals or long dwell times can reveal service strain. Compare each result with related measures before taking action.
| Metric | What it shows | Action to take |
|---|---|---|
| Vehicle utilization. | Share of available time spent in productive use. | Reassign low-use vehicles or review fleet size. |
| Asset availability and downtime. | Capacity ready for work and time lost. | Review failure causes and maintenance schedules. |
| Jobs per vehicle. | Work completed by each active unit. | Balance workloads across vehicles and crews. |
| Route completion. | Planned stops or routes finished. | Review plans, capacity, and missed stops. |
| On-time arrival. | Visits reached within the promised window. | Adjust dispatch rules and route timing. |
| Dwell time. | Time spent stopped at jobs or facilities. | Find process delays and reduce avoidable waits. |
Start with a stable reporting period and define each metric before comparing teams. For example, decide whether vehicle utilization counts travel, work-site time, or both. Clear rules keep results useful when managers are tracking fleet analytics metrics across different routes and job types.
Customer service impact
Operational gains matter most when they support reliable service. Track on-time arrival beside route completion and dwell time to see whether added jobs hurt the customer experience. A rising jobs-per-vehicle result paired with more late arrivals signals that the workload may be too high.
Dwell time also needs context. A long stop may point to a slow handoff, poor site access, or work that needs more care. Review exceptions with dispatchers and field teams before setting a target. This step helps avoid rewarding speed when the job requires time.
Use trends to guide small tests, not to punish one driver or crew. Compare similar routes, vehicles, and service windows, then check whether the change improves both capacity and reliability. Teams can also utilize fleet analytics metrics with connected operational data to build a clearer view of performance.
How do you turn fleet data into an operating rhythm?
A dashboard becomes useful when it drives a repeatable decision, an assigned action, and a follow-up date. The goal is not to review every chart. It is to focus each role on the few fleet analytics metrics that show where action is needed.
Build the weekly control loop
Start with a short set of measures tied to cost, safety, service, and asset health. The NIH fleet program uses telematics data for rightsizing and trip planning. It also uses a fleet system to track real-time fuel use throughout the year.
Use the following process to turn the same types of signals into a steady operating rhythm:
-
Set the baseline. Record a typical starting point for fuel use, idle time, utilization, downtime, safety events, and cost per mile. Use several normal weeks so one unusual day does not distort the baseline.
-
Define action thresholds. Set a clear trigger for each measure, such as a jump above baseline or a repeat event. Each threshold should name the action it starts, not just mark a chart red.
-
Assign role ownership. Give each metric one owner who can act. Dispatch may own route exceptions, supervisors may own coaching, and maintenance may own fault alerts and service dates.
-
Review exceptions each week. Send owners a short list of vehicles, routes, or drivers outside the set limits. Review the cause, assign the next action, and record its due date.
-
Connect data to coaching and maintenance. Hold brief driver coaching sessions on a fixed cadence. Route fault codes, mileage triggers, and repeat issues into the maintenance queue before they cause downtime.
-
Review ROI each month. Compare current results with the baseline and the cost of each action. Keep measures that guide decisions, adjust weak thresholds, and retire reports that create no action.
Keep weekly reviews focused
Exception reporting keeps the meeting centered on changes that need a response. A weekly review should answer four questions: What moved, why did it move, who owns the response, and when will it be checked?
Keep the driver coaching cadence separate from the wider operations review. Supervisors can discuss repeat speeding, harsh driving, or idle events with drivers. The operations team can then check whether coaching changed the next reporting period.
Connect measures to business results
Monthly ROI reviews should link operating changes to fuel, maintenance, labor, safety, and service results. Teams already utilize fleet analytics metrics when they connect telematics data with safety, compliance, and cost workflows.
Do not judge a measure by how polished its chart looks. Judge it by whether it causes a timely decision and a measurable follow-up. If a threshold creates constant noise, narrow its scope or change its limit before the next weekly cycle.
Why your analytics platform must fit your fleet
A generic dashboard may show totals, but it rarely reflects how your operation makes decisions. Each fleet has its own mix of vehicles, routes, service goals, risks, and reporting needs. Your platform should turn fleet analytics metrics into clear actions for the people who manage those areas.
Start with the decisions your team needs to make each day, week, and month. Then choose the data, alerts, and reports that support those choices. This approach keeps teams focused on useful signals instead of a growing set of charts.
Metrics built around operating goals
Operations directors need different views for cost, safety, maintenance, productivity, and customer service. A maintenance lead may track downtime and service status. A regional manager may need utilization, route patterns, and fuel use by branch.
The platform should also let each role move from a summary to the source data. That path helps managers find the cause behind a change. It also supports fair coaching, sound budget choices, and faster follow-up when results fall outside the expected range.
- Choose metrics tied to a clear owner and decision.
- Set alerts for issues that require timely action.
- Compare results across vehicles, teams, branches, and time periods.
- Review whether each report still serves an operating goal.
Public fleet programs use the same practical model. The NIH fleet management program uses telematics data for rightsizing and trip planning. It also tracks fuel use through a fleet management information system. These uses show why analytics should guide work, not just describe it.
Open connections that preserve context
Fleet data becomes more useful when it connects with the systems that already run the business. Those may include maintenance, dispatch, payroll, fuel, safety, or customer service tools. Open APIs and integrations reduce duplicate entry and help teams see the full operating picture.
Fleetistics supports a modular approach with free API access and more than 300 marketplace integrations. Teams can select the tools they need, then add functions as goals change. Fleetistics also brings a long history as a Geotab distributor to these connected deployments.
A connected system can combine location, vehicle health, and driver activity with business records. That context helps teams utilize fleet analytics metrics without forcing every department into one fixed workflow. It also makes reports easier to check against actual work.
Deployment that can grow without guesswork
Scale is not just the number of vehicles on a map. It includes new branches, changing rules, added asset types, and more people who need access. A suitable platform should support those changes without rebuilding every report or process.
Support matters during that growth. Fleetistics provides 24/7 support and a 60-day risk-free trial, so teams can test the fit before a broad rollout. A staged launch can confirm data quality, alert settings, user roles, and reporting value with a smaller group first.
- Define the business question before selecting a dashboard.
- Test integrations with real workflows and sample users.
- Confirm who owns alerts, reports, and follow-up actions.
- Expand after the first group shows reliable results.
The right fit is a platform that adapts as the fleet changes. Fleetistics’ Fleet Management Solutions combine modular tools, connected data, and ongoing support. That structure helps operations directors build analytics around real decisions instead of settling for a generic dashboard.
Frequently Asked Questions
What is the difference between fleet data and fleet analytics?
Fleet data is the raw information collected from vehicles, drivers, fuel records, maintenance systems, and customer visits. Fleet analytics organizes and compares that information to reveal trends, exceptions, and likely causes. For example, idle-time records are data. An analysis showing which routes, drivers, or vehicle types create the most avoidable idling is analytics.
How can fleet analytics reduce operational costs?
Fleet analytics exposes cost drivers such as excess idling, inefficient routes, low vehicle use, repeat repairs, and harsh driving. Operations directors can then prioritize changes and measure whether they work. The National Institutes of Health uses telematics data for fleet rightsizing, trip planning, and fuel-efficiency improvements that reduce fuel use and costs.
How does driver behavior affect fleet metrics?
Driver behavior affects safety events, fuel consumption, vehicle wear, maintenance demand, and arrival reliability. Harsh acceleration, speeding, hard braking, and unnecessary idling can raise costs while increasing risk. Compare behavior metrics by route, vehicle type, and working conditions before coaching drivers. This approach helps managers identify patterns without treating every event as an individual performance problem.
Why should fleet managers track fleet performance metrics?
Tracking fleet performance metrics helps managers find problems early, set measurable priorities, and confirm whether operational changes deliver results. A balanced scorecard connects cost per mile and fuel use with safety, utilization, downtime, productivity, and customer service. Reviewing those measures together prevents one improvement, such as higher utilization, from creating hidden costs or safety concerns elsewhere.
Ready to Turn Fleet Data Into Lower Costs?
Each week without a shared analytics view allows fuel waste, unsafe driving patterns, underused vehicles, preventable maintenance surprises, and service delays to continue unnoticed. Waiting makes it harder to set reliable baselines, assign ownership, compare locations, and prove which operating changes reduce costs without causing new problems. Starting now gives your team time to choose useful metrics, build a steady review rhythm, and improve decisions before the next planning cycle.
Ready to turn fleet data into clear actions for safety, utilization, fuel use, productivity, costs, and customer service across your entire operation? Call 855.300.0527 to speak with a consultant about a fleet analytics demo and create a practical plan for measuring meaningful results from day one.