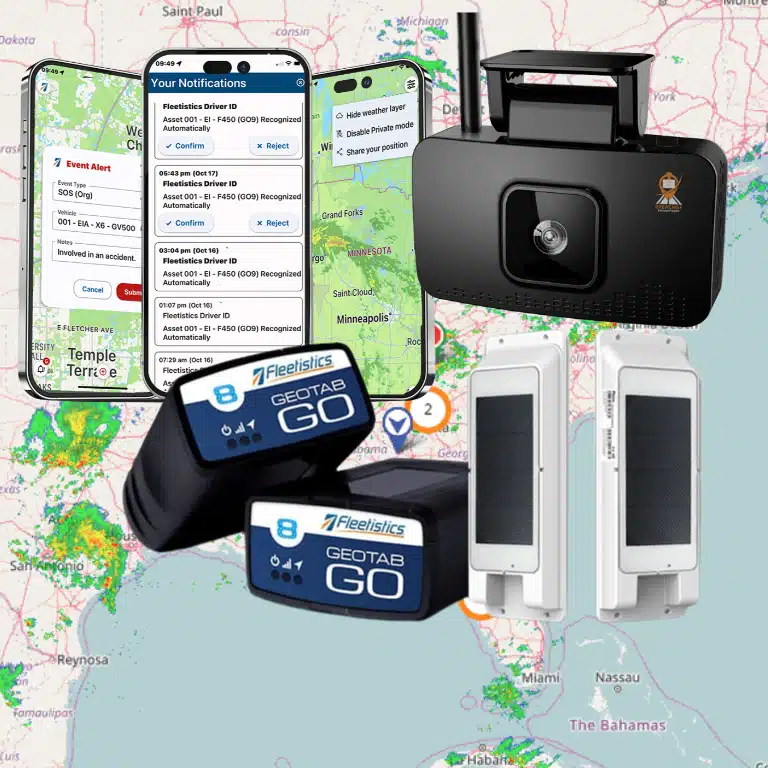

Fuel use is rarely determined by one dramatic decision. More often, small amounts of idle time, extra mileage, poor maintenance, and inconsistent driving accumulate across every vehicle and route. That makes efficiency a management question, not just a miles-per-gallon score.
Fleet fuel economy measures how much fuel a vehicle or fleet uses to perform useful work. It accounts for conditions such as miles driven, idle time, route variance, dwell time, load, and vehicle condition. The right baseline depends on the fleet, routes, weather, and operating patterns.
Discuss your fleet efficiency goals with Fleetistics A useful review starts by separating fuel consumed while moving from fuel consumed while stationary, then connecting those numbers to utilization and cost per vehicle. That broader view gives you a clearer starting point for deciding what to measure first and where operational changes can have the greatest effect.
What Does Fleet Fuel Economy Measure?
Fleet fuel economy is more than a miles-per-gallon number. It describes how efficiently a vehicle or group of vehicles uses fuel while completing real work, such as deliveries, service calls, construction jobs, or scheduled routes. MPG can provide a useful starting point, but it does not explain whether extra fuel came from idling, unnecessary miles, long dwell times, vehicle condition, or operating conditions.
For that reason, fleet managers should evaluate fuel use alongside the operational data that shapes it. A useful baseline can include fuel consumed, miles driven, idle time, route variance, deadhead miles, dwell time, utilization, and cost per vehicle. The right mix depends on the fleet and the decisions you need to make.
Fuel economy versus fuel cost
Fuel economy and fuel cost answer different questions. Fuel economy asks how much fuel was used to perform the work. Fuel cost adds the price paid for that fuel, which can change even when vehicle performance does not. A fleet can improve its fuel economy while fuel prices rise, or spend less on fuel because prices fall without becoming more efficient.
Measure both, but do not use cost alone to judge operational performance. Compare vehicles and routes using consistent periods, similar loads, and comparable service demands. Results can vary with fleet type, vehicle condition, routes, weather, loads, and driver behavior, so a single fleet-wide average may hide the cause of a change.
Build a baseline before changing behavior
Start with a defined observation period and record the same measures for each vehicle, route, or operating group. Telematics can help compare actual and planned routes, identify unauthorized stops or extended breaks, and show job-site dwell time. That makes it easier to connect fuel use with an operational cause instead of treating every difference as a driver issue. You can review GPS tracking and real-time fleet visibility as one way to organize this information.
Illustrative baseline example: Suppose 10 service vehicles each travel 2,000 miles during a four-week period. The fleet records total fuel, average idle time, route variance, dwell time, and cost per vehicle. The manager then compares those measures by vehicle and service territory. If two vehicles use more fuel, the data may show different causes: one has more idle time, while the other accumulates more unplanned miles. The example is a measurement framework, not a promised result or customer outcome.
Once the baseline is stable, change one operational behavior or process at a time and compare the next period with the original conditions. This gives operations leaders responsible for costs, utilization, and driver performance a clearer basis for coaching, maintenance decisions, route planning, and return-on-investment reviews.
How Does Idling Affect Fleet Fuel Economy?
An engine that is running while a vehicle is stationary consumes fuel without adding miles or completing a delivery. Some idle time is operationally necessary, but avoidable warm-ups, extended waits, unauthorized stops, and overnight cab comfort can make it a measurable drag on fuel economy. The EPA estimates that long-duration truck idling consumes about 1 billion gallons of fuel annually, and notes that reducing it can decrease fuel costs and engine maintenance costs: EPA idling-reduction guidance.
Find the idle time you can control
Start with a baseline instead of assuming every idle event is waste. Compare engine-on time with vehicle speed, location, time of day, outside temperature, route stage, and job status. A telematics system can help separate loading or passenger-service requirements from patterns that deserve review. Track idle minutes per vehicle, idle minutes per operating hour, fuel consumed during idle, and the cost associated with that fuel. Review the same period for several weeks before changing policy so weather, seasonal demand, and route mix do not distort the comparison.
Context matters. A published study of 20 long-haul trucks monitored for more than a year across 2.76 million miles found that the trucks typically idled for 2,000 or more hours per year. In that study, average base-engine fuel use ranged from 0.46 to 0.65 gallons per hour. Rates varied with weather and engine speed. Those findings describe the monitored long-haul sample, not a guaranteed result for every fleet. Your own idle data should determine the opportunity.
Turn idle data into coaching
Convert the baseline into a policy drivers can understand. Define when idling is required for safety, cargo, climate, or equipment operation, then identify the specific events that can be reduced. Use short coaching conversations supported by trip-level examples rather than publishing a leaderboard without context. The EPA identifies driver training and financial incentives as strategies for changing idling behavior, but incentives should reinforce safe. Compliant decisions, not pressure drivers to shut down when conditions require the engine to run.
Technology can address legitimate stationary needs. EPA describes idling-reduction technologies that provide heat, air conditioning, or electricity without operating the main drive engine while equipment is parked. Depending on the vehicle and duty cycle, an auxiliary power unit or another approved system may be worth evaluating. One long-haul study found lower fuel use for APUs than base engines. It also cautioned that achievable reductions depend on how much base-engine use the alternative actually replaces. Use that context when modeling payback, rather than treating a published percentage as a fleet-wide promise.
For a broader measurement and control approach, review telematics fuel management systems alongside your idle reports, driver coaching process, and operating policies.
Can Routing and Deadhead Miles Change Fuel Economy?
Yes. A vehicle can have acceptable MPG and still produce poor fleet fuel economy when it travels extra miles, waits between jobs, or returns empty. Route variance, deadhead miles, traffic, load, and dispatch decisions all change how much fuel is used to complete the same work.
The EPA notes that route optimization can minimize truck miles and account for delivery windows, vehicle characteristics, restrictions, and hours-of-service limits. Manual planning is also harder to adapt when traffic, weather, or customer orders change. Many platforms use real-time traffic and driver-availability data to adjust routes dynamically, while route-deviation alerts help operators investigate what changed.
| Planned signal | Actual signal | Operational response |
|---|---|---|
| Planned miles and delivery sequence | Route variance, extra stops, or unauthorized travel | Review dispatch assumptions, stop sequencing, and route adherence |
| Loaded miles and expected vehicle capacity | Deadhead miles, partial loads, or repeated returns to base | Test consolidated routes, different vehicle capacities, or delivery days |
| Scheduled arrival and service duration | Traffic delay, extended dwell, or a late departure | Replan dynamically and separate unavoidable delay from dispatch friction |
These signals should be interpreted together. A heavier load can increase fuel use, but an underutilized vehicle may waste fuel through additional trips. Weather and congestion can create unavoidable variance, while poor sequencing or long dwell may be operationally correctable. Results also depend on the vehicle, route, load, and driver behavior, so avoid treating one MPG change as proof that a routing change caused the result.
Fleetistics identifies route optimization as a way to reduce deadhead miles and improve schedule efficiency. Telematics can then compare planned and actual routes, identify extended breaks or unauthorized stops, and show job-site dwell time. That evidence gives dispatchers a practical basis for coaching, revised route rules, or dynamic replanning rather than relying on driver recollection.
Measure miles before buying more capacity
When service demand rises, first measure loaded miles, empty miles, dwell, stops per route, fuel used, and work completed by vehicle and route. EPA guidance describes scenario planning with different vehicle capacities, delivery days, and customer locations. In some operations, better utilization or dispatch may address the constraint more efficiently than adding a vehicle. Build the baseline, test one operational change, and compare results across similar routes and loads before making a capacity decision.
Which Vehicle Conditions Reduce Fuel Economy?
Vehicle condition can quietly change fuel use even when routes, loads, and driver assignments appear unchanged. Tire pressure, rolling resistance, engine warning signals, oil specification, payload, and weather all affect the energy required to move a vehicle. Because results vary by vehicle type and operating conditions, treat maintenance as a measurable contributor to fleet fuel economy, not as a fixed savings guarantee.
Start with tire pressure and rolling resistance
Begin with the pressure specified by the manufacturer, not the maximum number printed on the tire sidewall. FuelEconomy.gov reports that maintaining proper inflation improves gas mileage by 0.6% on average and by up to 3% in some cases. Its guidance also estimates that under-inflation can lower gas mileage by about 0.2% for every 1 psi drop in the average pressure of all tires. These figures are reference estimates, not a promise for every fleet or vehicle.
Underinflated tires flex more under load, create heat, and increase rolling resistance. They can also wear faster and less evenly, with more frequent punctures. Pressure loss is easy to miss during a busy service schedule: truck tires can lose up to 2 psi per month even when rim seals and valve stems are tight. A pressure check at inspection, supported where appropriate by a tire pressure monitoring system, gives drivers and maintenance staff a practical early warning.
Your inspection workflow should record cold pressure, tread or wear observations, visible damage, load condition, and corrective action by vehicle. Compare fuel use after the correction against a similar route and load rather than judging the result from a single trip. Weather matters too. Cold temperatures, heat, rain, wind, and changing road surfaces can alter rolling resistance and fuel demand.
Connect maintenance data to fuel data
Maintenance signals deserve the same attention as fuel transactions. FuelEconomy.gov advises addressing an illuminated check engine light promptly because a vehicle may seem to drive normally while an issue reduces fuel economy. Increases emissions, or leads to a more expensive repair. Use the vehicle’s recommended grade of motor oil as well. FuelEconomy.gov estimates a 1% to 2% mileage improvement from using the manufacturer’s recommended grade, while the wrong grade can reduce mileage in some applications.
Load is another operating condition to document. Compare vehicles performing similar work by payload, trailer or equipment configuration, route, and weather. A fuel increase may reflect heavier work rather than a mechanical fault, but a persistent change alongside warning codes, tire discrepancies, or missed service intervals deserves inspection.
A connected maintenance process can turn those observations into a repeatable review. Proactive fleet maintenance helps your team connect service schedules and vehicle signals with fuel and utilization data. Review exceptions weekly, assign an owner, and verify the outcome after the repair. This approach protects fuel economy while supporting uptime, safety, and more defensible maintenance decisions.
FuelEconomy.gov maintenance guidance provides the tire inflation and motor-oil recommendations cited in this section.
How Can Driver Behavior Improve Fleet Fuel Economy?
Driver behavior affects how efficiently fuel becomes productive work. Rapid acceleration, inconsistent speed, unnecessary route deviations, and extended idling can add fuel use without improving completed jobs. The goal is not to demand one driving style from every operator. It is to identify repeatable patterns, understand the operating context, and coach practical decisions that fit the vehicle, route, load, and service commitment.
Coach patterns, not people
Start with observable events rather than labels. Review hard acceleration, abrupt braking, speed variation, idle time, route adherence, unauthorized stops, and dwell time alongside the job schedule. A delivery route with a heavy load, steep terrain, traffic, or weather disruption may explain behavior that looks unusual in isolation. Telematics can compare planned and actual routes and show extended breaks or job-site dwell, giving a manager evidence for a productive conversation.
Transparency is essential. Tell drivers what data is collected, why it matters, who can see it, and how it will be used. Pair coaching with a written policy, consistent review standards, and a way for drivers to explain exceptions. The EPA identifies driver training as a strategy for reducing idling, and notes that fleets may also use financial incentives. Any incentive should reward safe, compliant, efficient work, not encourage speeding, rushed decisions, or skipped breaks.
Use the same governance standard across the fleet. Avoid public leaderboards that shame individuals or turn fuel performance into a contest detached from workload. Recognize improvement, investigate outliers privately, and separate safety violations from coaching opportunities. This approach builds buy-in while keeping the measurement focused on operating results.
Review the right metrics weekly
A useful weekly loop is simple: establish a baseline, test one or two interventions, compare the same type of work, and adjust. Track fuel consumed with idle time, miles driven, route variance, deadhead miles, dwell time, and cost per vehicle. Segment the results by vehicle, route, load, and driver so an apparent improvement is not merely a change in assignments or operating conditions.
For example, compare a vehicle’s pre-coaching weeks with its post-coaching weeks on similar routes and loads. Look for movement in idle minutes per operating hour, fuel per mile or job, route variance, and completed work. Results depend on fleet type, vehicle condition, routes, weather, loads, and driver behavior, so treat the comparison as evidence for the next decision, not a guaranteed outcome. Use the measure fleet fuel savings resource to frame the financial impact of those measured changes.
Discuss your fleet efficiency goals with Fleetistics
Frequently Asked Questions
Which fuel economy metrics should a fleet track first?
Start with fuel consumption, miles driven, idle time, deadhead miles, route variance, dwell time, and cost per vehicle. Reviewing these measures together shows whether fuel use is driven by distance, stationary engine time, routing, or operating conditions instead of relying on MPG alone. Fleet analytics guidance supports this baseline approach.
How much fuel can proper tire inflation save?
The result depends on the vehicle and operating conditions, but underinflation creates extra rolling resistance and wastes fuel. EPA guidance says tires inflated 10 psi below the recommended level can reduce truck fuel economy by 0.5% to 1%. Tires can also lose up to 2 psi per month, so scheduled checks matter. EPA tire guidance
How can a fleet separate driver behavior from route or vehicle issues?
Compare similar vehicles and routes, then segment results by driver, load, weather, idle time, route variance, and maintenance status. Use a pre-change baseline and review the same measures afterward. This helps distinguish coaching opportunities from conditions a driver cannot control, such as traffic, vehicle condition, or changing loads.
Is telematics required to improve fuel efficiency?
No. A fleet can begin with fuel records, odometer readings, idle observations, maintenance checks, and route documentation. Telematics can make the process more consistent by showing actual versus planned routes, dwell time, and other operating patterns. The right approach depends on fleet type, routes, vehicle condition, weather, loads, and driver behavior.
Ready to Evaluate Your Fleet Fuel Economy?
A useful next step is to review your current baseline alongside idle time, routing patterns, maintenance signals, and driver-coaching priorities. A consultative evaluation can help you identify which measurements deserve attention first and how to organize a practical efficiency plan around your fleet’s operating conditions.