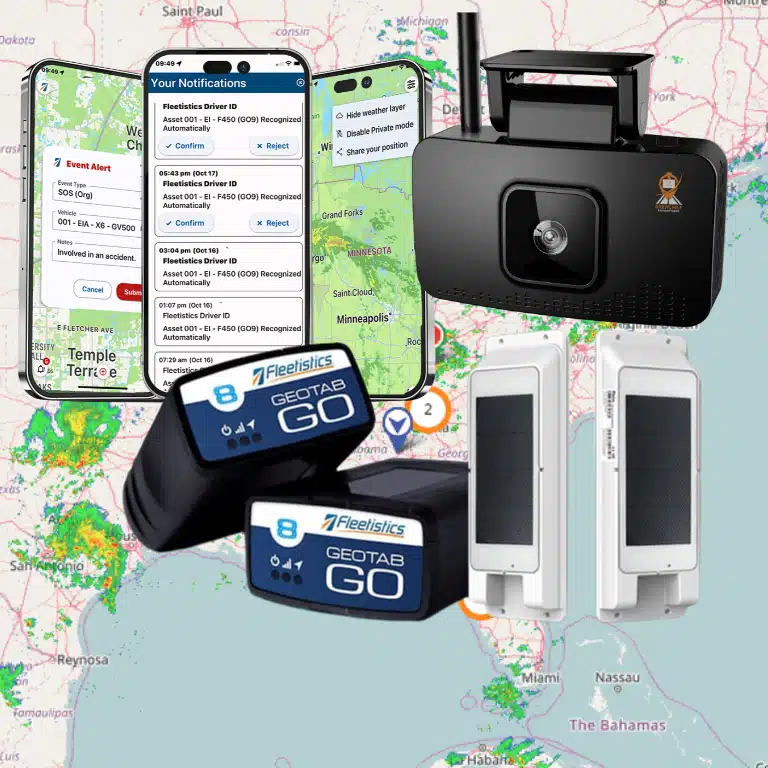

Fleet data analytics is useful when it helps an operations leader make a timely, specific decision—not simply when fleet reporting dashboards display more numbers. A dependable reporting setup connects relevant data, clear metric definitions, and an agreed response. Start with the questions your team needs to answer, then choose reports and dashboard views that help the right person act.

Discuss your fleet reporting needs
What should a fleet data analytics dashboard help you decide?
Begin with an operating decision, not a chart. A fleet reporting dashboard earns its place when it helps a manager respond to an issue, allocate resources, or check whether a change is working. If a number never changes a decision, it may not belong on the main view.
Write down the recurring questions your team asks. Examples include:
- Which vehicles or assets are active, idle, unavailable, or overdue for attention?
- Where are fuel use, mileage, or idle time outside the expected pattern?
- Are routes, service calls, or scheduled tasks being completed as planned?
- Which safety events need a consistent review or follow-up?
- Are maintenance tasks being completed before they disrupt operations?
- Can supervisors see the exceptions that require action today?
Give each question an owner and a response. An exception report for overdue maintenance, for example, is only useful if someone checks it, confirms the underlying information, and updates the work order or schedule. That turns a fleet reporting dashboard from a passive display into part of an operating process.
Different roles need different levels of detail. An executive may need a trend and an exception count; a dispatcher may need vehicle-level status; a maintenance lead may need mileage and diagnostic details. Fleet management software can support organization-wide summaries and detailed records, but the same data does not need to appear in the same way for every user.
Which fleet data analytics metrics belong on the main view?
Choose a small set of measures that connect to your goals. A screen packed with every available field can hide important changes. Keep the first view focused, and make supporting detail available when someone needs to investigate.
| Operating goal. | Useful measures or reports. | Decision supported. | Check before relying on it. |
|---|---|---|---|
| Vehicle availability. | Active status, utilization, downtime, exceptions. | Reassign work or investigate underused capacity. | Define active time and exclude planned downtime consistently. |
| Fuel control. | Fuel transactions, fuel economy, idle time, anomalies. | Review a vehicle, route, or operating practice. | Confirm transaction and mileage data are complete and comparable. |
| Service reliability. | Route progress, stops, completion status, delays. | Adjust dispatch or investigate recurring delays. | Check that planned routes and actual activity use matching definitions. |
| Maintenance planning. | Odometer readings, fault alerts, scheduled work. | Plan service and reduce avoidable disruption. | Validate readings, intervals, and follow-up responsibility. |
| Safety review. | Event trends, coaching status, incident records. | Prioritize review and targeted coaching. | Use consistent event definitions and a fair review process. |
These are examples, not a universal scorecard. A field-service fleet may focus on coverage and job completion, while a public works team may care more about equipment availability and seasonal deployment. A team operating watercraft or mixed assets may need different status and location measures than a road fleet. Match the report to the work, not to a generic template.
Where it makes sense, pair leading measures with outcomes. A completed coaching follow-up is an activity; a change in a safety trend is an outcome. A scheduled maintenance task is a plan; unplanned downtime is an outcome. Showing both helps managers see whether a process is being followed and whether it appears to be helping.
For a fuel-focused example, the U.S. Department of Energy’s FleetDASH tool presents agency- and fleet-level summaries as well as individual vehicle fuel transaction summaries. Its scope is federal fleets, but it illustrates why a useful reporting view can combine a broad summary with a way to examine vehicle-level detail.
How do you keep metrics meaningful?
Define each metric in plain language before comparing it across teams or time periods. State its data source, calculation, time window, exclusions, and owner. If one supervisor counts a vehicle as active while another does not, their totals cannot support a fair comparison.
For every metric on a main dashboard, record:
- Definition: What exactly is counted, and what is excluded?
- Source: Which system or record supplies the input?
- Refresh timing: How current must the information be for the decision?
- Threshold: What makes a result worth investigating?
- Owner: Who checks the result and records the response?
A threshold should trigger a review, not automatic blame. An unusual fuel result, missed stop, or safety event can have several explanations. Check for incomplete records, changed assignments, different operating conditions, and device or process issues before drawing a conclusion.
Data quality is operational work. Assign responsibility for vehicle and asset records, driver or group assignments, maintenance data, and manual inputs. Review missing or stale records as part of routine reporting. If a measure depends on a source outside the tracking platform, identify how often it updates and how the systems match records.
Fleet data analytics may draw on more than one system. Before assuming that every source can be combined automatically, map the fields and identifiers, determine who maintains them, and test a representative sample. Fleetistics describes data integration capabilities as part of its fleet technology offering; confirm which connections fit your specific workflow.
What fleet reporting dashboard views should different users see?
Build views around responsibilities. An operations leader may need a compact summary of exceptions and trends, while a dispatcher needs information that supports decisions during the shift. A maintenance coordinator may need service triggers and vehicle details. A safety manager may need an orderly way to review events and follow up.
Keep the management view focused on changes and exceptions. Provide a path from a summary to the underlying record so the user can verify context. Avoid placing sensitive details in broad-access views when the audience does not need them. Access should match each person’s role and duties.
Decide how users will receive information. Some teams benefit from a live operational view; others need a scheduled report for a recurring review. Alerts are useful when a response is time-sensitive and the trigger is clear. Too many low-value alerts train people to ignore them, so test thresholds and remove notifications that do not drive a response.
A 2020 study, “A Dynamic Dashboarding Application for Fleet Monitoring”, describes dashboard use for monitoring fleets of assets, including vehicles and other equipment. For a buyer, the practical lesson is to test whether a view supports the monitoring task rather than judging it by appearance alone.
Consider the difference between monitoring and diagnosis. A dispatcher may need a clear indication that a vehicle is delayed; a manager investigating a recurring delay may need route, schedule, and historical context. Put the urgent signal where it is easy to find, then make the supporting detail accessible without forcing every user through it.
How should you compare dashboard options?
Compare options against the same real tasks and sample data. A polished screen is not proof that reports are accurate, understandable, or easy to act on. Ask each provider to show the workflow from summary to record to follow-up.
| Evaluation area. | Questions to ask. | Evidence to request. |
|---|---|---|
| Coverage. | Can it represent the vehicles, equipment, or watercraft we operate? | A demonstration using your fleet types and operating scenarios. |
| Data and definitions. | Can we trace a total to source records and understand its calculation? | Metric definitions and a sample detail report. |
| Timeliness. | How often does each view update, and what may be delayed? | Refresh behavior tested against a known event. |
| Role fit. | Can managers and frontline users see the information they need? | Separate walkthroughs for the people who will use it. |
| Integration. | Can it use relevant records from existing systems? | Field mapping, ownership, and a tested sample connection. |
| Action and adoption. | Can users assign, document, and follow up on exceptions? | A pilot with named users and a review routine. |
Consider openness and future fit as well as the initial feature list. Fleetistics works with Geotab technology and describes an open ecosystem that includes APIs and integrations. Ask what data is available, how access is governed, and whether the required connection is included in the proposed configuration. Do not assume every integration supports every field or workflow.
Modularity matters because fleet needs differ. A small operation may need straightforward location and utilization views; a larger or more complex organization may need deeper reporting, additional data sources, or role-specific processes. Select the capability that addresses a real requirement, then confirm how it can scale as operations change. Ask for a demonstration that reflects your reporting tasks rather than simply displaying the broadest feature list. Review fleet reporting resources as a general starting point for preparing specific questions about your setup.
How can you run a useful dashboard evaluation?
A structured evaluation makes it easier to separate meaningful fit from a persuasive demonstration. Use a short set of representative tasks and include the people who will use the reports.
- Choose three to five decisions. Include a daily operational question and at least one review that happens weekly or monthly.
- Set baseline definitions. Agree on units, time periods, asset groups, and exclusions before looking at results.
- Select sample users. Include an operations leader and the frontline or specialist roles responsible for responding.
- Test normal and exception cases. Check an ordinary day, a missing record, a changed assignment, and a result that crosses a review threshold.
- Trace a result. Select a dashboard figure and follow it back to its supporting records. Confirm that users understand what it does and does not mean.
- Record actions and friction. Note time to find the answer, confusing terms, extra steps, and who owns follow-up.
- Review after the pilot. Keep views that helped decisions, revise definitions that caused disagreement, and remove measures no one uses.
Use a decision log rather than relying on general impressions. Record the task, result, data limitation, user feedback, and any configuration needed. For example, if a reviewer cannot explain why a fuel report differs from a card statement, capture the vehicle, time period, missing transaction, and follow-up owner. This turns a vague concern into a testable data question.
Include both routine and edge cases. A single clean example may hide stale records or mismatched asset identifiers. Try a known maintenance event, a vehicle assignment change, and a period with missing input. Ask the user to explain what they would do next, not just whether the chart looks clear.
Plan rollout around the review routine, not just the software setup. Name a metric owner, set the first review date, and agree where users will record decisions and data corrections. Introduce one view to a small group, collect examples of confusing labels or missing detail, and adjust definitions before sharing it more broadly. If a fleet reporting dashboard will inform employee-facing decisions, explain what is collected and why, limit access to people who need it, and establish a transparent process for reviewing exceptions. Training should include how to verify a result and how to report a suspected data issue, not only where to click.
Fleet managers evaluating broader tools can also review Geotab Ace and fleet insights as one possible reporting discussion, then confirm current capabilities against the tasks you defined. For a larger view of the platform, explore Fleetistics fleet management solutions and assess whether the available modules match your operation.
How do you turn reports into action?
Each recurring report should fit an operating rhythm. Decide who reviews it, when, what counts as an exception, and where the response is documented. A daily view may support dispatch decisions, while a monthly review may highlight patterns that deserve policy, training, or scheduling changes.
Start with a small set of actions that have clear owners. If a report shows repeated idle time, verify assignments and operating context before deciding whether a route, schedule, or coaching conversation is appropriate. If utilization appears uneven, compare the work assigned and the asset’s availability before shifting resources. If maintenance alerts are missed, check both the alert logic and the follow-up process. Fleetistics also provides information about fleet maintenance software and diagnostics for teams considering that workflow.
Connect measures to a specific operational question when reviewing costs. Fuel economy trends, for example, are more useful when interpreted with mileage, routes, vehicle assignments, and operating conditions. See Fleetistics’ guidance on fleet fuel economy and the factors that shape results; assess any opportunity against your own baseline and records.
Do not treat a dashboard as a substitute for judgment or direct communication. Data can indicate where to look, but managers should validate circumstances with appropriate records and people. When reporting involves driver activity or safety, explain the purpose, set appropriate access and retention practices, and use transparent, consistent review procedures.
Then check whether the reporting routine is working. Are the right people reviewing the exception? Is the data available when they need it? Are actions recorded and revisited? If a report repeatedly produces no decision, simplify it, change the threshold, or remove it from the regular view.
What does a practical reporting review look like?
Imagine a manager sees that one group of vehicles has more idle time than the previous month. The figure is a prompt to investigate, not proof of a problem. First confirm the date range, vehicle assignments, and whether the current report includes parked time or authorized waiting. Then compare like with like: similar routes, work schedules, and vehicle types.
Next, check the underlying records for a representative sample. If a subset of vehicles accounts for the change, ask supervisors whether assignments or operating conditions changed. If the increase is concentrated in one route or time window, examine that operating context before suggesting a schedule change. Record what the review found, what action was chosen, and when the team will check the result again.
This same sequence works for safety and service measures. Look at a trend, verify the events behind it, apply a consistent review process, and document follow-up. Fleetistics has a separate resource on fleet safety analytics for teams that need to examine safety-related reporting. For a broader cost review, the fleet savings summary can help frame which operating measures to assess, while your own baseline determines whether a change is meaningful.
The point is to preserve the chain between signal and decision. A dashboard can surface a pattern quickly, but users still need context, traceable records, and an owner for the next step. If the team cannot explain how a number was produced or what response it should prompt, revise the metric or workflow before expanding its use.
What should you ask a provider before choosing?
Use direct questions to uncover how a proposed dashboard works in practice:
- Which data sources feed each important metric, and how can users inspect the underlying records?
- How are vehicle, driver, asset, and location records kept consistent?
- What is the refresh timing for each view, and how are gaps or delayed data shown?
- Can users create role-appropriate views without losing consistent metric definitions?
- How are reports shared, exported, or connected to other business systems?
- What user training and support are available during setup and after rollout?
- How will the solution accommodate a changing mix of vehicles, equipment, and workflows?
Ask for a demonstration using scenarios that reflect your work rather than a standard tour. Bring a sample reporting problem, such as finding an overdue service item or investigating a route exception. A useful walkthrough should make the data path, user steps, and follow-up process clear. If a proposed report depends on an integration, ask to see which fields are transferred and how discrepancies are handled.
Book a fleet reporting consultation
Frequently asked questions
What is fleet data analytics?
Fleet data analytics is the process of organizing and interpreting fleet information to support operating decisions. Depending on the operation, it may include location, utilization, fuel, maintenance, safety, and service data.
What is the difference between a report and a dashboard?
A report typically presents information for a defined question or time period. A dashboard brings selected measures and exceptions together for monitoring. Many teams need both: a summary for quick review and detailed reports for investigation.
How many metrics should appear on a fleet dashboard?
There is no single ideal number. Put only the measures users need for recurring decisions on the main view, and make supporting details available separately. Clear definitions and ownership matter more than filling the screen.
How can a fleet team improve trust in its dashboard data?
Document how metrics are calculated, assign owners for source records, review missing or stale data, and test results against known events. Give users a way to inspect detail and flag discrepancies for correction.
Can a dashboard combine information from multiple systems?
It may be possible, but the answer depends on available data, identifiers, connection methods, and configuration. Map the fields and responsibilities, then test a representative sample before relying on combined measures.
Ready to evaluate your fleet reporting needs?
A practical dashboard starts with decisions, trustworthy definitions, and clear ownership—not a longer list of charts. Fleetistics combines Geotab technology with modular fleet management solutions; discuss your fleet type, reporting questions, and data sources with the team to identify a suitable next step.
Contact Fleetistics to discuss your requirements
Choose a focused pilot, document what users learn, and expand reporting only when it supports a real operating need.