
Fleet insight is more than a map with vehicle dots or a dashboard full of charts. It is the operational understanding that helps a fleet manager decide what needs attention now, what can wait, and which trend deserves a closer look before it becomes an expensive problem.
For mixed fleets, that distinction matters. A service van, dump truck, trailer, excavator, and emergency vehicle do not create the same data or follow the same work pattern. The best metric program gives managers a consistent way to compare readiness, risk, utilization, cost, and service outcomes without pretending every asset should be measured identically.
What is fleet insight?
Fleet insight is the ability to turn vehicle and equipment data into a clear operational decision. It combines information such as location, utilization, diagnostic events, maintenance status, fuel use, safety behavior, and service activity, then puts that information in the context of the work your fleet is expected to perform.
A report tells you what happened. Fleet insight helps explain why it happened and what to do next. For example, a low-utilization vehicle may need reassignment, a high-idle unit may need route or driver coaching, and repeated diagnostic alerts may justify a planned shop visit before an unplanned outage.
That makes fleet insight a management process, not simply a software feature. The technology should make the process faster by bringing reliable data together, highlighting exceptions, and helping the right person act on them.
Which fleet metrics help managers act faster?
The most useful fleet insight metrics connect a measurable condition to a repeatable decision. Start with a small scorecard covering safety exposure, utilization, readiness, fuel efficiency, and service execution. Add diagnostic metrics only when they help explain a change in one of those outcomes or trigger an assigned follow-up.
These five metric groups give managers a practical starting point for vehicles, trailers, powered equipment, and other tracked assets.
1. Safety exposure and driver behavior
Safety metrics should help a manager identify coaching opportunities and recurring risk patterns, not create a leaderboard that ignores route, weather, vehicle type, or job conditions. Useful measures can include speeding events, harsh braking, rapid acceleration, seat belt events when available, collision-related alerts, and driver coaching completion.
The decision question is not simply, “Who had the most events?” Ask, “Which events are repeated, preventable, concentrated in a route or vehicle, and still unresolved?” A manager can then prioritize a conversation, review a trip, adjust a policy, or investigate a vehicle or camera alert. The Federal Motor Carrier Safety Administration driver-safety resources can support a broader safety program.
2. Utilization, availability, and assignment
Utilization measures whether an asset is being used in line with the work it is assigned to support. The formula should match the asset type. Miles or engine hours may be useful for vehicles and powered equipment, while a trailer or stationary asset may be better evaluated by days assigned, movement frequency, or time available at a job site.
Track utilization alongside availability. A vehicle that is not moving may be idle because demand is low, because it is waiting for a driver, or because it is unavailable for repair. Those situations require different decisions. The fleet manager should be able to see the exception, identify the reason, and decide whether to reassign, maintain, replace, or retain the asset.
3. Maintenance readiness and downtime
Maintenance insight connects scheduled work, diagnostic signals, work orders, and out-of-service time. A useful scorecard can include preventive maintenance compliance, open work orders, overdue services, unscheduled repair frequency, downtime days, and time from fault detection to resolution.
Pair each metric with a threshold and owner. For example, an overdue inspection can go to the maintenance coordinator, while repeated engine faults on an active route may require immediate review by operations. Fleetistics supports maintenance scheduling, reminders, work orders, and vehicle data that can help teams move from reactive repairs toward planned maintenance.
4. Fuel use and idle time
Fuel metrics are most useful when they are normalized for the work being performed. Review fuel use by vehicle, route, job type, engine hours, miles, and idle time where those comparisons are meaningful. A high fuel total may be expected for a heavy-duty unit, while a smaller service vehicle with unusual idle time may deserve faster investigation.
Look for a pattern rather than a single unusual reading. Compare a vehicle with its own baseline, similar assets, and the work it completed. Then ask whether the response is a route change, idle reduction coaching, maintenance inspection, fuel-control review, or a change in assignment. Fleetistics documents fuel savings of up to 14% in relevant customer and solution contexts, but every fleet should validate its own baseline before assigning a savings target.
5. Service execution and customer impact
Fleet managers need metrics that show whether the fleet is supporting the service promise. Depending on the operation, this can include on-time arrival, time at job sites, route deviation, missed stops, response time, dispatch-to-arrival time, and completed work per available vehicle or crew.
Service metrics connect fleet activity to the outcome a customer or internal department actually experiences. A route that looks efficient on a map may still cause missed appointments if the vehicle is assigned too far away, spends too long at avoidable stops, or goes out of service during a busy period. Use the metric to find the workflow constraint, not simply to judge the driver.
Contact Us Today to Map Your Fleet Insight Priorities

How do you connect a fleet metric to a decision?
A fleet metric becomes actionable when its definition, comparison point, threshold, owner, and next step are clear. Managers should not have to interpret a different formula every week or search five systems to understand one exception. Build a repeatable review path that moves from signal to context, decision, action, and follow-up.
- Define the measure: Write the formula, time period, asset population, and source system in plain language.
- Set the comparison: Use a baseline, prior period, peer group, route, job type, or asset class that makes the result meaningful.
- Assign the threshold: Decide what counts as normal, needs review, or requires immediate action. Avoid thresholds that treat every asset as identical.
- Name the owner: Route the exception to operations, maintenance, safety, dispatch, finance, or a supervisor who can act.
- Close the loop: Record what changed and review whether the metric improved. If it did not, revisit the diagnosis rather than simply raising the threshold.
This process also helps prevent dashboard overload. If a metric never changes a decision, it may belong in an occasional report instead of a daily operating view.
What should a mixed-fleet insight scorecard include?
A mixed-fleet scorecard should use common business outcomes while allowing each asset type to use an appropriate operating measure. Safety, readiness, utilization, cost, and service can be shared across the fleet. The supporting formulas should reflect whether the asset is a road vehicle, powered equipment, trailer, watercraft, or stationary unit.
| Outcome | Useful measures | Decision it can support |
|---|---|---|
| Safety | Preventable events, speeding, harsh braking, coaching completion | Prioritize coaching, policy review, trip review, or equipment investigation. |
| Readiness | Availability, overdue maintenance, open faults, downtime | Schedule service, escalate a fault, reassign work, or plan a replacement. |
| Utilization | Miles, engine hours, assignment days, movement frequency | Rebalance assets, adjust dispatch, or review capacity. |
| Fuel and energy | Fuel per mile, fuel per hour, idle time, unauthorized activity | Investigate route, idle, maintenance, or fuel-control issues. |
| Service | On-time arrival, response time, stops completed, time at site | Improve assignment, routing, staffing, or customer communication. |
Use the table as a framework, not a requirement to collect every field. The right scorecard may contain different measures for a delivery fleet, construction fleet, municipality, utility operation, or emergency-services team. Fleetistics supports vehicle and asset tracking, telematics, dashcams, maintenance tools, fuel solutions, and integrations that can help bring those views together.
Contact Us Today to Connect Fleet Data to Better Decisions
How should you evaluate fleet insight software?
Evaluate fleet insight software by testing whether it helps your team answer operational questions quickly and consistently. A long feature list is less important than clean data, useful context, clear ownership, and a practical path from alert to action. Ask to see the workflows your managers will use after the initial implementation.
- Can it support mixed assets? Confirm that the platform handles vehicles, equipment, trailers, and other assets without forcing every unit into one formula.
- Can managers see causes as well as results? A fuel total or downtime number is more useful when the team can examine route, diagnostic, assignment, or work-order context.
- Can teams create role-based views? Operations, maintenance, safety, dispatch, and finance need different decision views from the same underlying information.
- Can alerts become assigned work? Ask how an exception is acknowledged, routed, documented, and closed so alerts do not become an ignored inbox.
- Can the data connect to existing systems? Open APIs and integrations reduce duplicate entry and help preserve the systems your team already relies on.
- Can the vendor help establish a baseline? A consultative partner should help define success measures, validate data, and refine the scorecard during evaluation.
Also ask how the platform handles data quality. A manager needs to know whether a missing trip, stale device, disconnected asset, or incomplete work order could change the conclusion. Confidence in the data is part of fleet insight, not a separate technical detail.
How does Fleetistics help fleet managers act on insight?
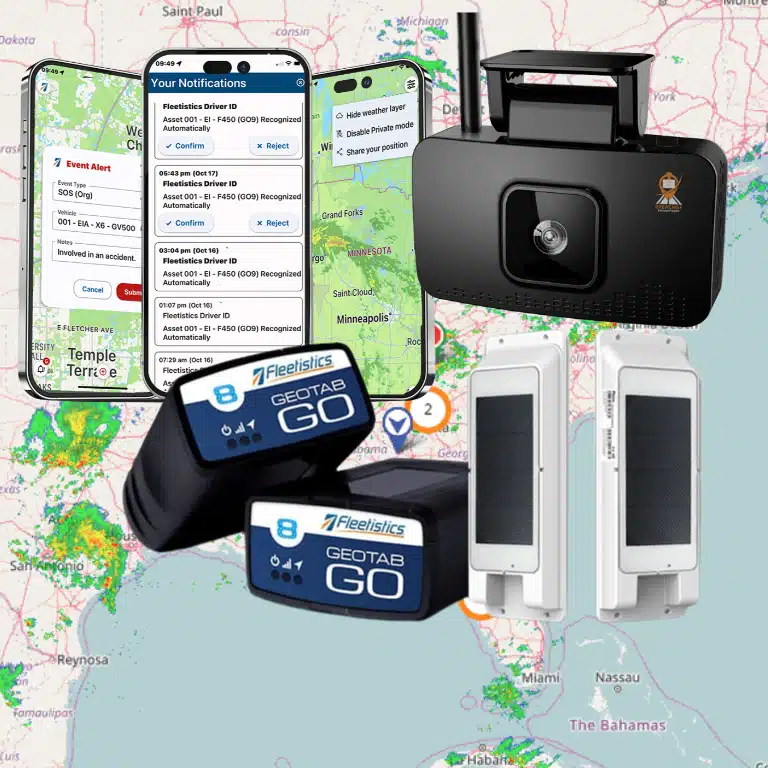
Fleetistics combines Geotab-powered telematics, vehicle and asset tracking, analytics, maintenance capabilities, safety tools, and open integrations to help fleets build a decision process around their actual work. The goal is not to prescribe one scorecard. It is to match the data, workflows, and reporting cadence to the fleet’s operating model.
That flexible approach can support a fleet that needs better visibility into utilization, a maintenance team that needs earlier fault context, or a safety leader who needs consistent coaching signals. Fleetistics also supports mixed fleets of vehicles, equipment, and watercraft across the USA, Canada, and Mexico.
Relevant resources include Fleetistics analytics for reporting and analysis, fleet fuel management guidance for fuel and idle decisions, and fleet safety solutions for layered risk reduction. Teams comparing platforms can also review the fleet management platform comparison before defining requirements.
Fleetistics has served fleets since 2001 and provides 24/7 support. Its consultative process helps a team test assumptions, define useful metrics, and validate ROI through the 60-day Solution Evaluation Process instead of treating implementation as a one-size-fits-all software purchase.
Speak With a Fleetistics Consultant About Your Fleet Metrics
Frequently Asked Questions
What is the difference between fleet insight and fleet tracking?
Fleet tracking shows where vehicles or assets are and may provide related trip data. Fleet insight goes further by connecting location with safety, utilization, maintenance, fuel, and service context so a manager can choose and assign a next action.
What is the most important fleet metric?
There is no single most important fleet metric for every operation. Start with the outcome that matters most to your business, then pair it with leading indicators. For example, service reliability may require on-time arrival, vehicle availability, route deviation, and maintenance readiness.
How many fleet KPIs should a manager track?
Track enough KPIs to explain the decisions your team makes, but not so many that important exceptions disappear. A small scorecard across safety, readiness, utilization, fuel, and service is a practical starting point. Add diagnostic measures only when they lead to a defined action.
How do fleet metrics work for construction equipment?
Construction equipment can use engine hours, assignment days, idle time, location, utilization, fault events, and maintenance readiness instead of relying only on vehicle miles. The right fleet insight framework keeps the business outcome consistent while adapting the measure to the asset.
How can a fleet manager improve data-driven decisions?
Define each metric, establish a baseline, set an action threshold, assign an owner, and review the outcome after the action. A platform with reliable telematics, integrations, and consultative implementation support can make that process easier to repeat.
What is the next step for building fleet insight?
Start with one operational question your team needs to answer faster, such as which assets are underused, which vehicles are at risk of downtime, or where service reliability is slipping. Then identify the data, owner, threshold, and action required to answer it. Expand the scorecard only after the first workflow is useful.
Fleetistics can help you map those questions to a practical combination of telematics, analytics, maintenance, safety, and integration tools.
Contact Fleetistics to Build a Faster Fleet Decision Process