
ROI Under 90 Days
Calculate your estimated ROI
Unlock Efficiency, Control Costs, and Drive Success.

“Fleet tracking saves 10x the investment & averages less than 90 days!”
“Fleet tracking saves 3-5 TIMES the investment & ROI averages less than 90 days!”
14 Day Return On Investment!
Return on investment is driven by three variables. How your organization embraces these will determine the speed at which the ROI is achieved and the size of the financial benefit.
- Adherence to policies and procedures which is fed by data-driven decision. Are you willing to enforce the rules when data tells you there is an issue?
- Adoption of a GPS tracking and telematics system to generate data. The data from a GPS tracker is important to almost all departments of service, delivery and transportation companies.
- Management commitment. Is every manager from the field supervisor to senior leadership willing to embrace the data and be held to the same standards?

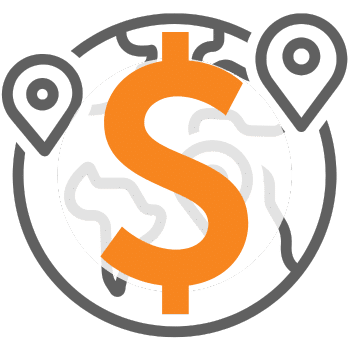
Save Up to $2400 Annually
Best-in-Class fleets attribute up to $2400 in annual savings per vehicle. Try our ROI calculator or call today!

Orkin Pest Control Case Study
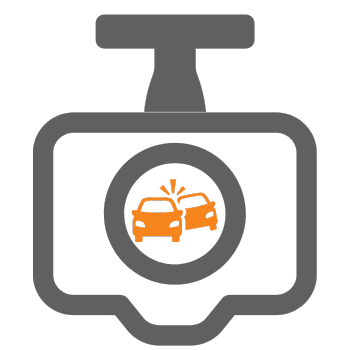
Orkin Pest Control pioneered the use of GPS tracking data in the late 1990’s. Orkin started by addressing the $25,000,000 annual issue of safety-related financial liability. Orkin implemented key policies around fleet safety. CEO, Mr. Rollins, mandated 100% compliance and for the past 10+ years have attributed $27m in savings to improved safety. Fleetistics should know because founder and president Eron Iler worked for Orkin Pest Control at the time and brought the GPS tracking technology to Orkin in 1997.
Orkin’s big Return on Investment win was based on communicating policy clearly to employees, and enforcing that policy. As a self insured fleet, every accident avoided translates to thousands in bent metal savings. Even more important is reducing if not eliminating collision related personal injury or loss of life.
With that in mind, we have guidance available on setting your policy and introducing it to employees.
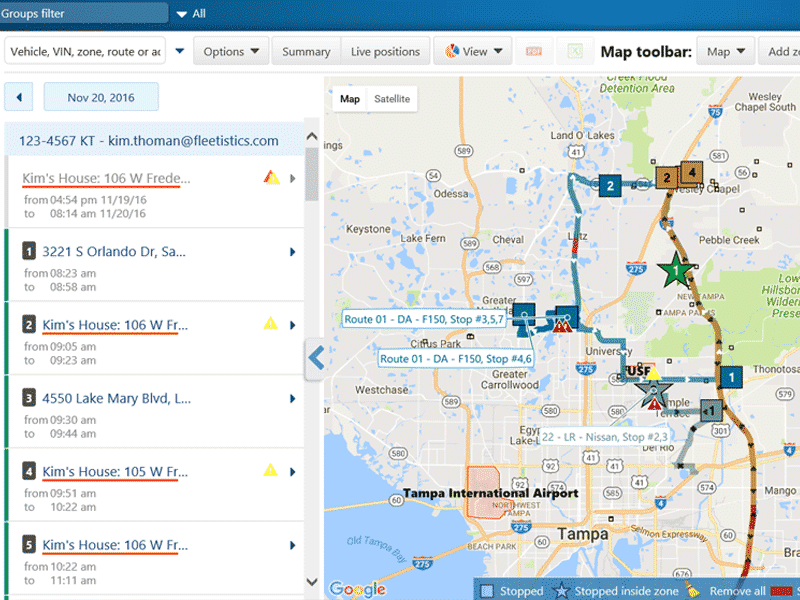
Optimize Routes for Fewer Miles
Route optimization can occur at many levels. Optimization will occur when dispatchers know which vehicle is near the next service call, drivers can see their routes on the map and find inefficiencies and data can be put into a robust routing program.
Basic routing is built into most systems. Integrations with our routing partners are beneficial to clients with more complex “time to service” challenges. Our highly trained staff can help you to assess what will work best for your fleet. We can even assess the routes you are currently driving against fully optimized routes for the same stops to see how much you can save.
Driving fewer miles and getting more done saves fuel and time while incresing profits.
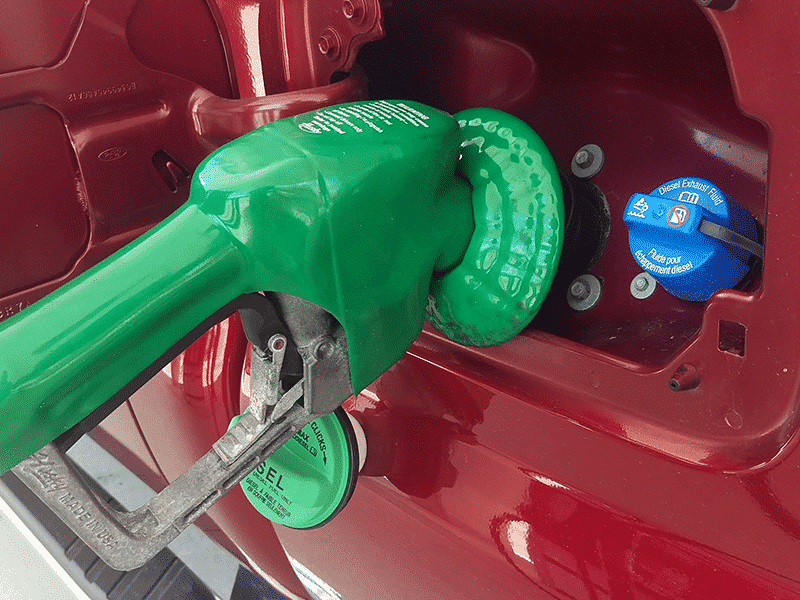
Track Fuel and Energy Consumption
Fuel efficiency reports give side-by-side fuel consumption data for all your fleet vehicles.
- Track Fuel Consumption
- Keep engines tuned
- Catch low MPG vehicles or models
- Control fuel types
- Monitor fuel spending v. maintenance
- Understand where EVs are suitable
- Better manage EVs in your fleet
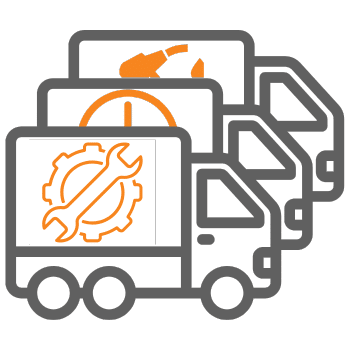
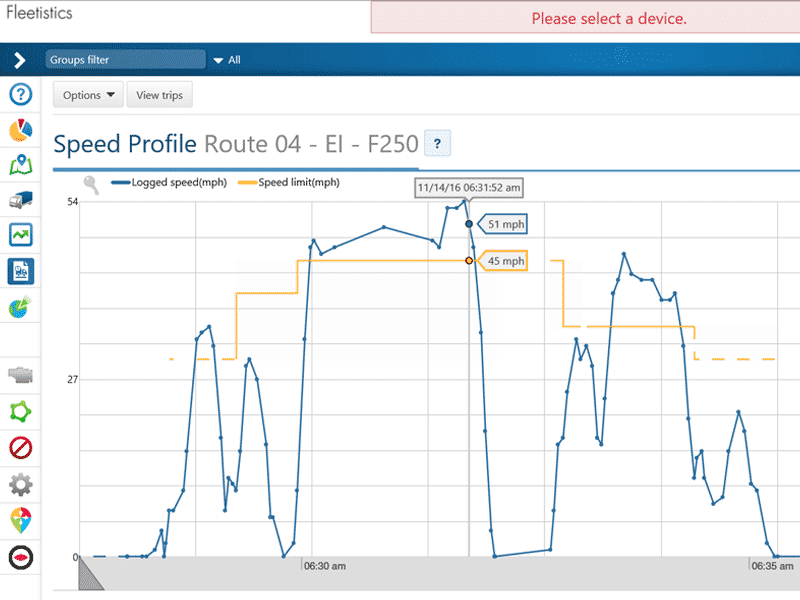
Reduced Wear & Tear
Even the simplest vehicle repairs can be very costly to your bottom line, especially if you have multiple vehicles on the road. Driving to fast, turning too hard, and frequent harsh braking add to the cost of maintaining your fleet. Add to that the vehicle downtime to do those repairs. Your jobs that need to be done may not be getting done as quickly as they should.

Engine Idle Expense – the low-hanging fruit
Most fleets have no idea how much money is wasted due to unnecessary idling.
| 2012 Vehicle & Engine Liter Size | Idle 5 Min./Day Annually | Idle 10 Min./Day Annually |
|---|---|---|
| Chevrolet Silverado 1500: 4.3 – 5.3 | $75-$100 | $150-$200 |
| Dodge RAM 2500: 5.7 | $108 | $216 |
| Ford F-150: 3.7 – 6.2 | $68-$111 | $136-$222 |
| Ford Focus: 2.0 | $34 | $68 |
| Honda Civic: 1.8 – 2.4 | $30-$42 | $60-$84 |
| Jeep Grand Cherokee: 3.6 – 6.4 | $65-$115 | $130-$230 |
| Subaru Outback: 2.5 – 3.6 | $45-$65 | $90-$130 |
| Toyota Prius: 1.8 | Hybrid – idling negligible | —– |
| Toyota RAV4: 2.5 – 3.5 | $45-$62 | $90-$124 |
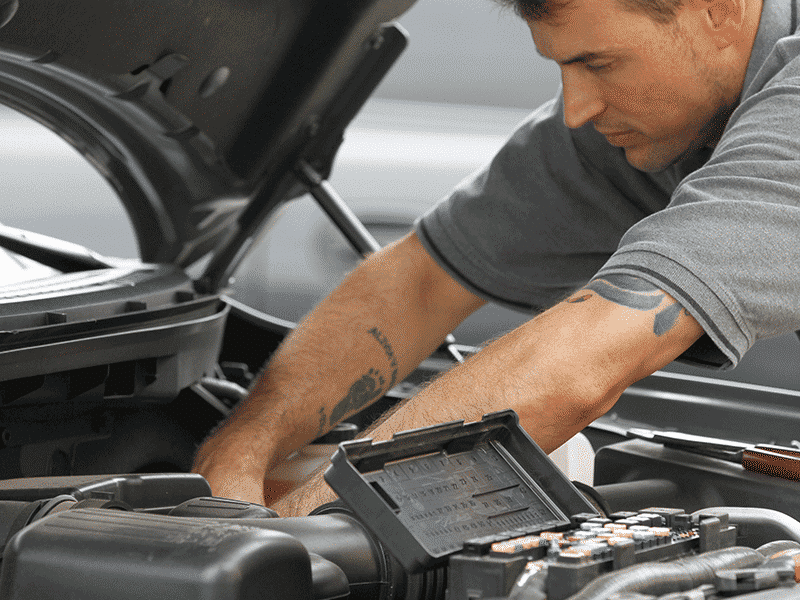
Planned vs. Unplanned Maintenance
Planned maintenance reminders help you stay on top of routine service work. Monitoring for engine faults alerts you to more serious problems potentially avoiding costly break downs. Our integrated partners add value by focusing on predictive engine health based on the data coming from your engine. You can be pro-active and keep your overall fleet maintenance costs down.