Custom Dashboards & Fleet Reports
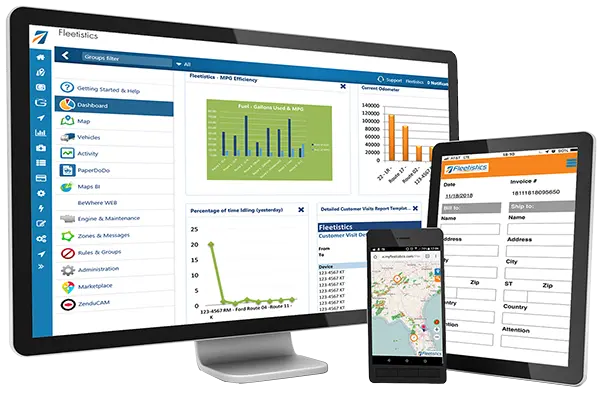
Data needed at the service manager level is very different than that needed at the fleet manager level or for sales management. Service managers likely need data through a map or a mobile app at a glance while in the field. Executives need fleet reports once a week that summarize key data and can be used to make strategic decisions. The GO platform is designed for diverse fleet management needs.
Rules & Exceptions
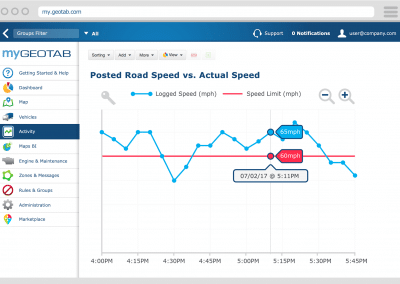
Fleet reports and dashboards can contain status data or data by exception. Exceptions are determined based on rules that the user creates and the vehicle activity that generates an exception to the rules.
Standard & Custom Rules
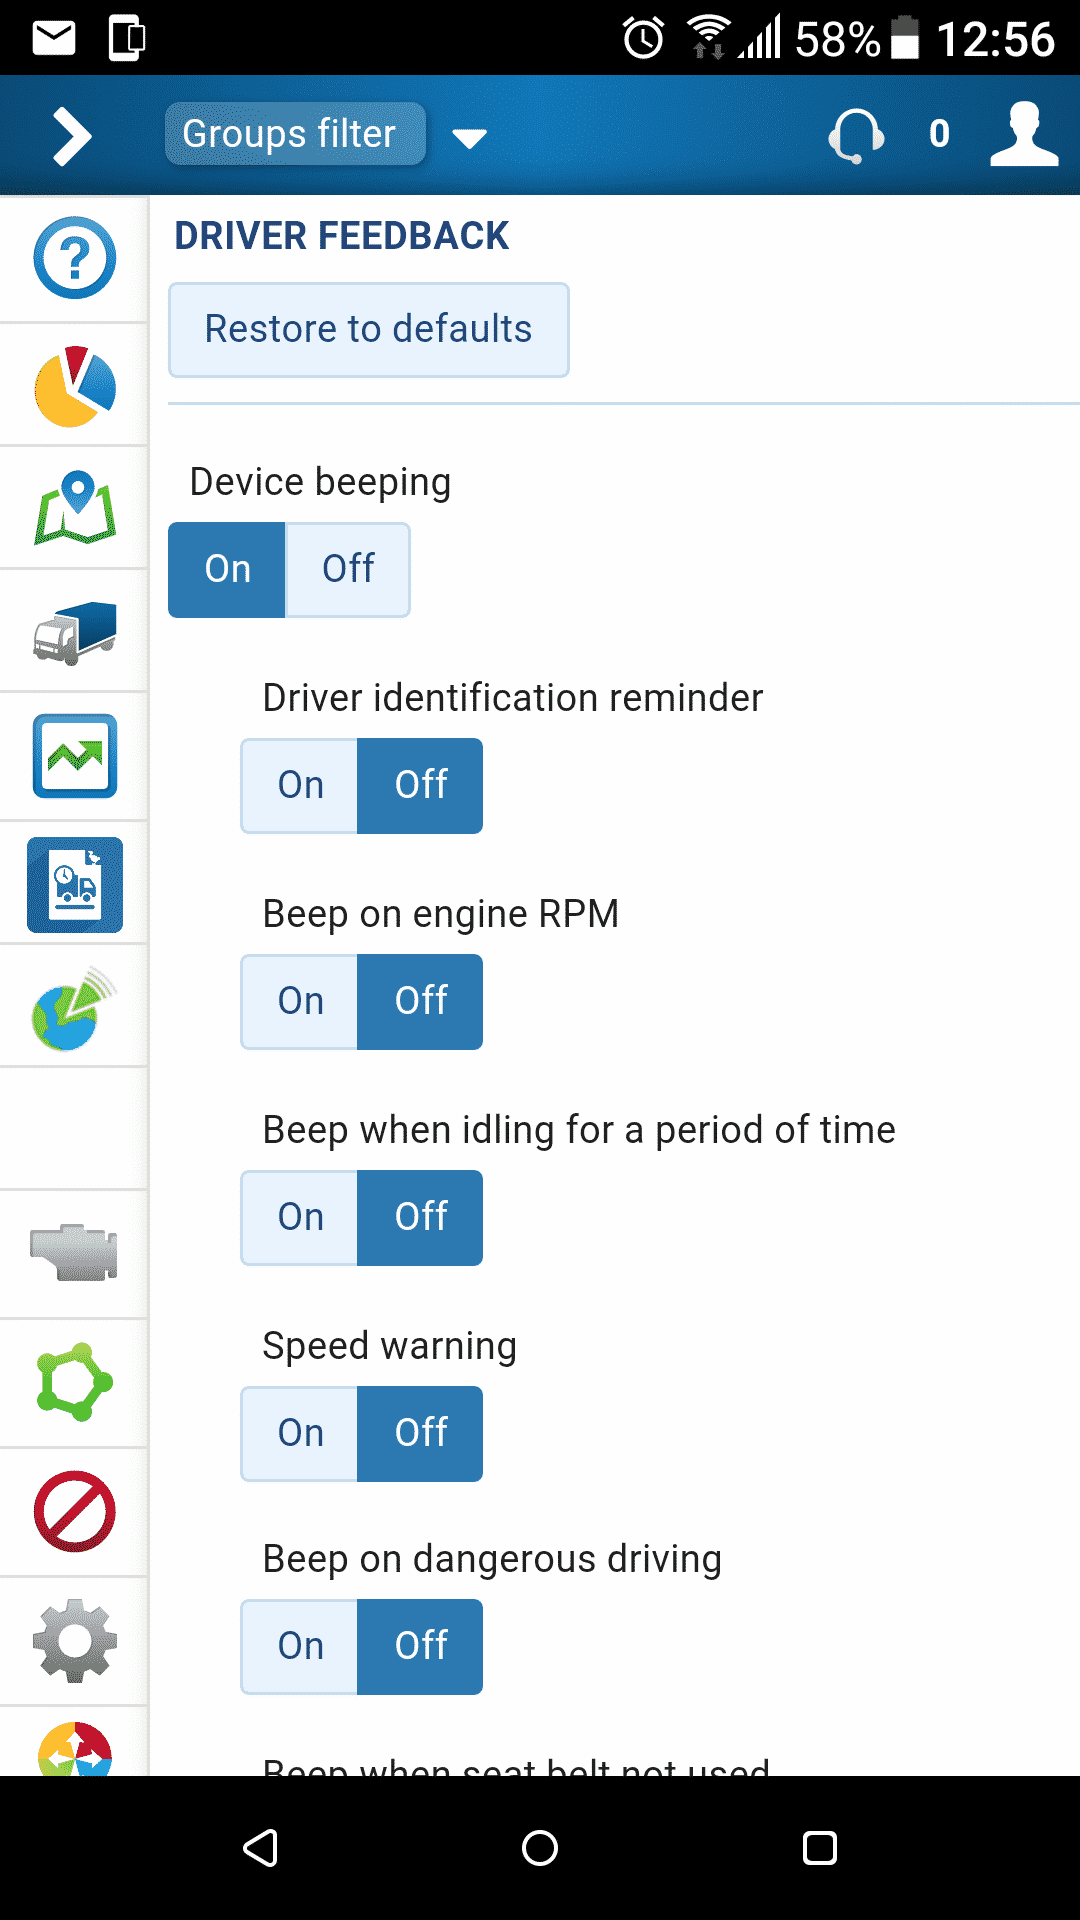
Geotab offers tremendous flexibility to create rules that focus data on your business. There are a wide variety of standard rules popular among fleet managers which offer quick and easy configuration. Custom rules use syntax to create rules very specific to unique situations.
Sample Custom Rule
No seat belt, for more than 60 seconds, for a distance great than 500 yards and over 20 MPH.
Grouping for Reports
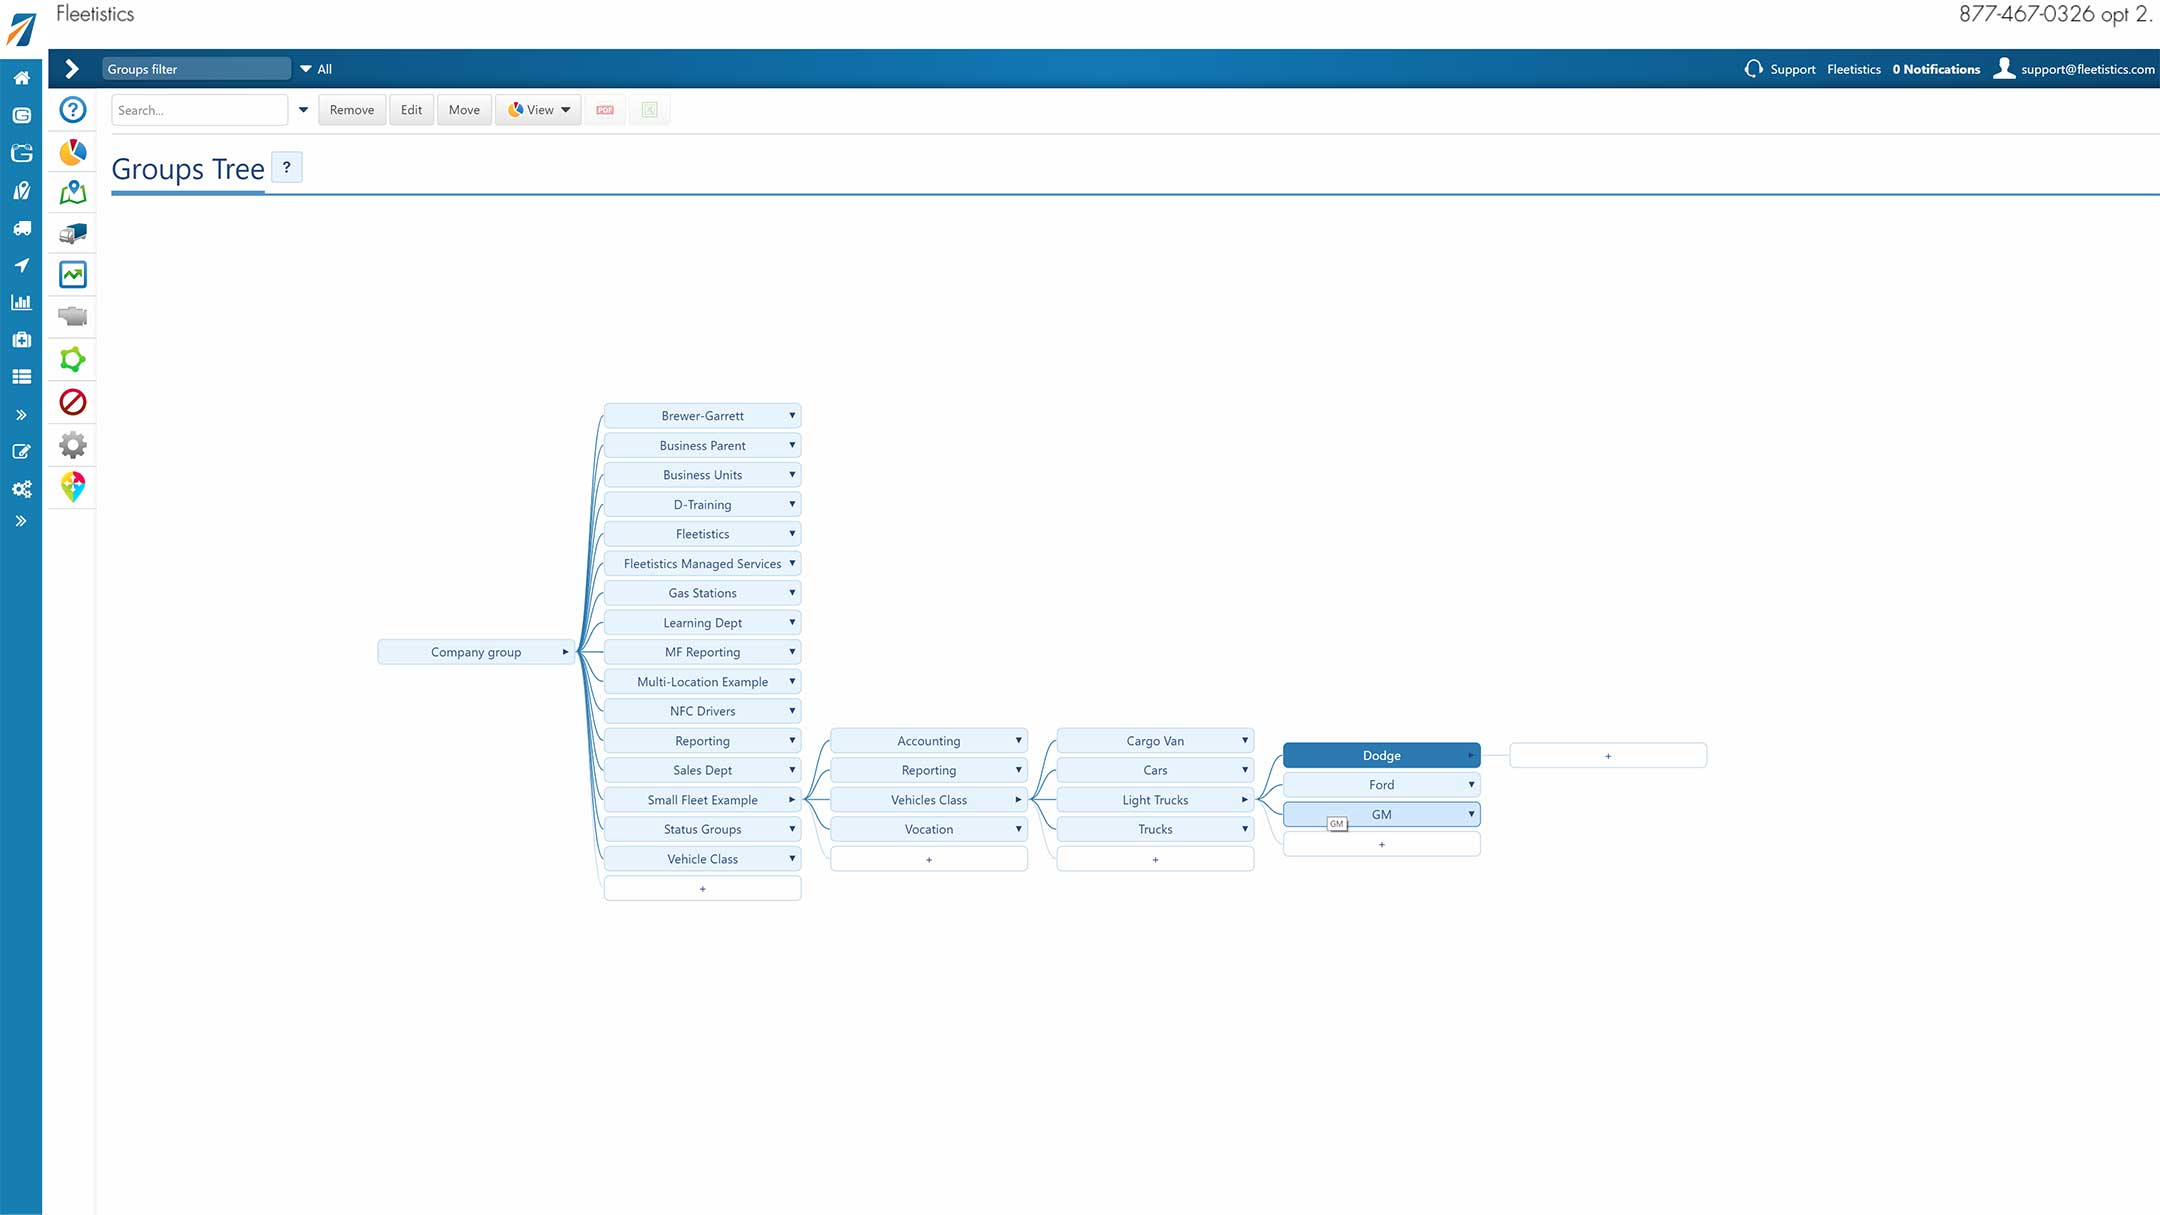
It is very important to understand the value of being able to group vehicles and data and assign access rights by group.
Limiting the scope of data based on the user’s area of responsibility improves the value of the data and increases security.
The Geotab GO platform provides extensive grouping flexibility such as GPS trackers, engine types, vehicle model year, service function, and more. This enables fleet managers to see associated costs and functions in new ways.
Importance of Grouping for Fleet Reports
It is very important to understand the value of being able to group vehicles and data and assign access rights by group.
Limiting the scope of data based on the user’s area of responsibility improves the value of the data and increases security.
The Geotab GO platform provides extensive grouping flexibility such as GPS trackers, engine types, vehicle model year, service function, and more. This enables fleet managers to see associated costs and functions in new ways.
Dashboards
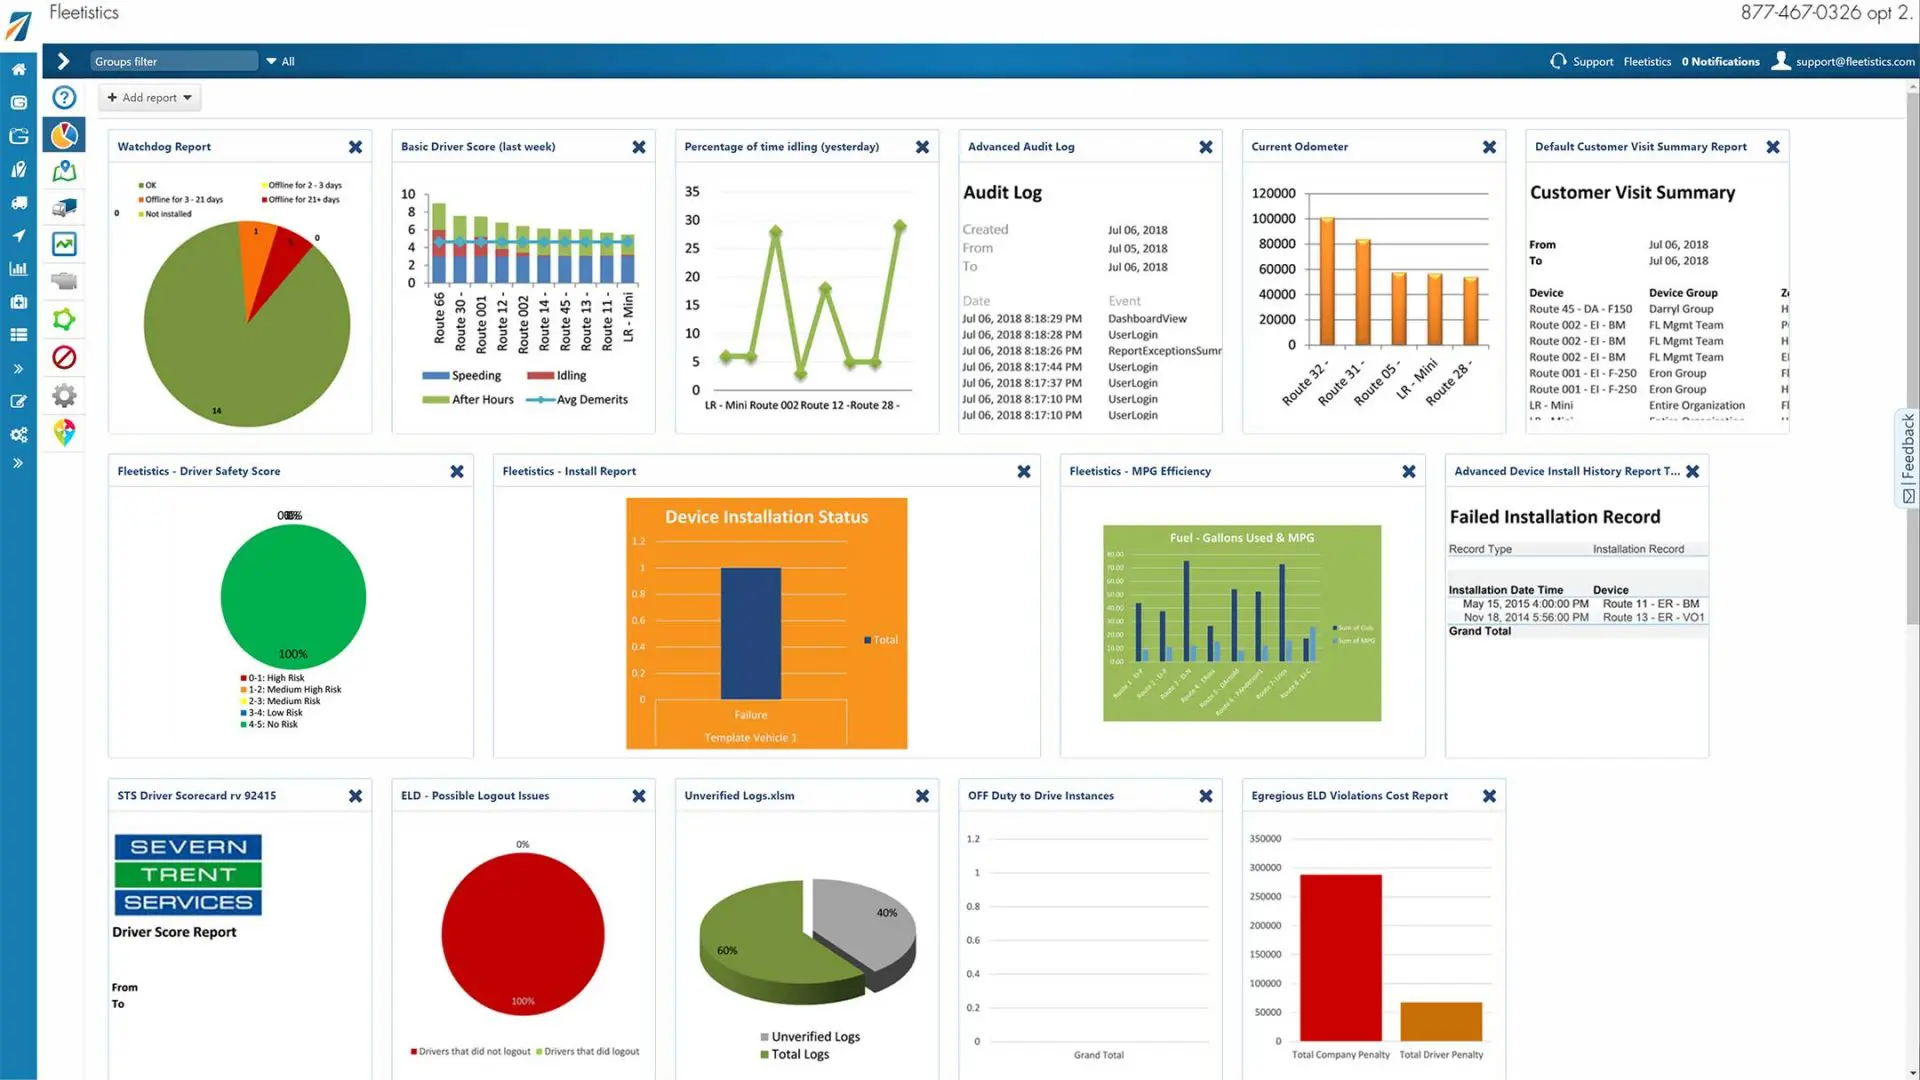
Custom dashboards at the user level. Dashboards are created using the standard fleet reports or by modifying a system report and saving back to the Geotab platform. Dashboards can be arranged using drag and drop and made accessible to specific user groups.
Dashboards
Custom dashboards at the user level. Dashboards are created using the standard fleet reports or by modifying a system report and saving back to the Geotab platform. Dashboards can be arranged using drag and drop and made accessible to specific user groups.
Trip History
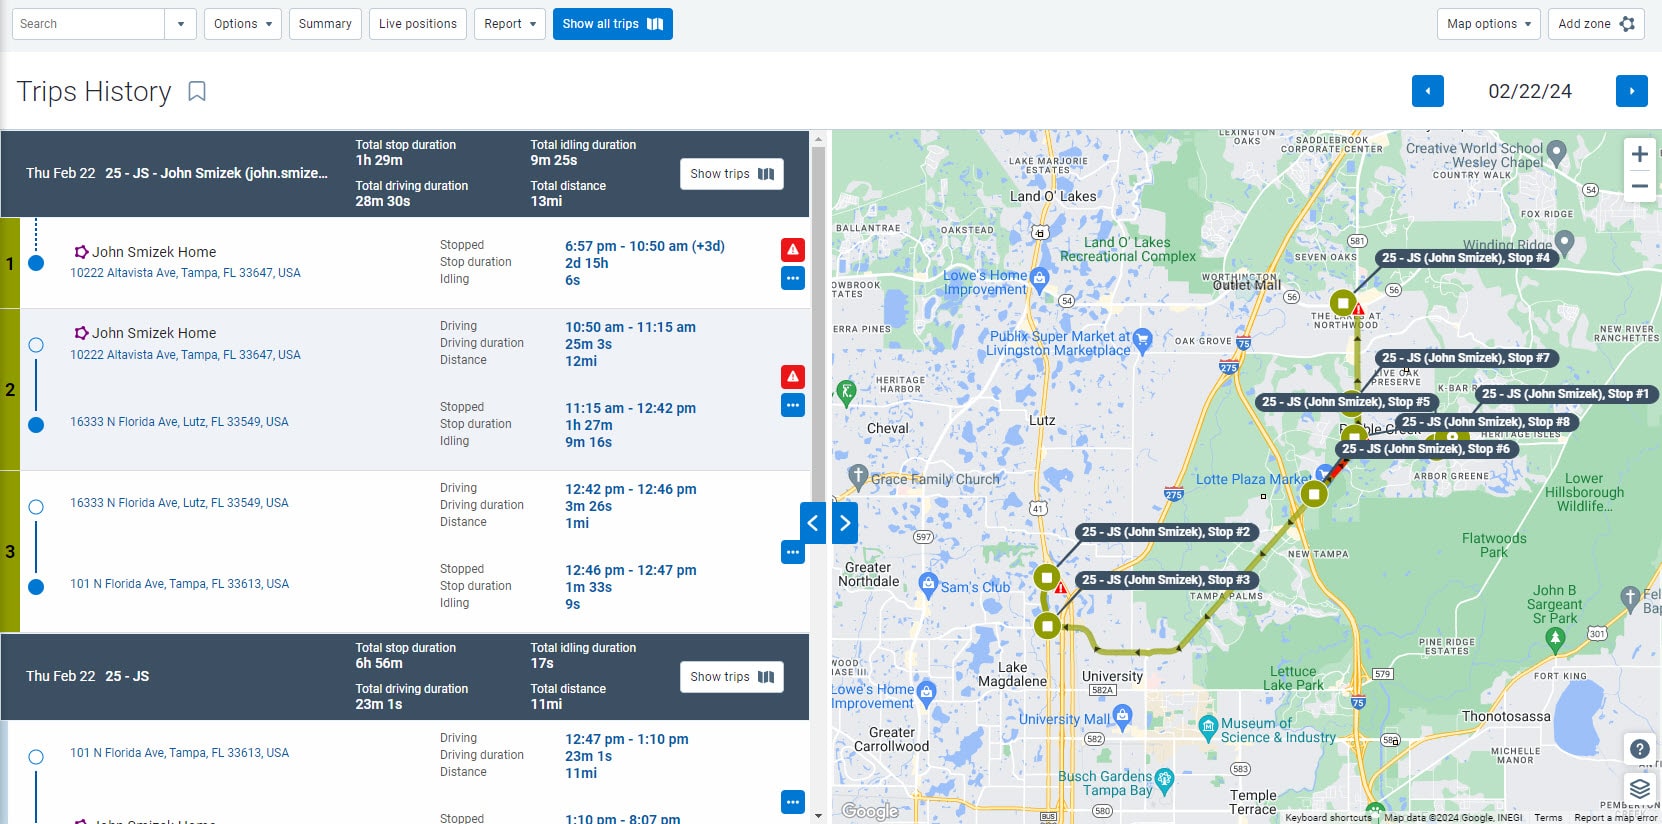
Trip History is also known as a Start-Stop report. This is the most commonly viewed of all fleet reports at the service department level because it details the day’s vehicle activity. This travel report shows every stop, time of the stop, stop duration, miles traveled, idle time, and generally the maximum speed.
Geotab reports also include exceptions specific to each trip when viewed online. All fleet management data from the Geotab platform is maintained for a minimum of one year but data has not been deleted in 20 years!
Fleet Reports Available
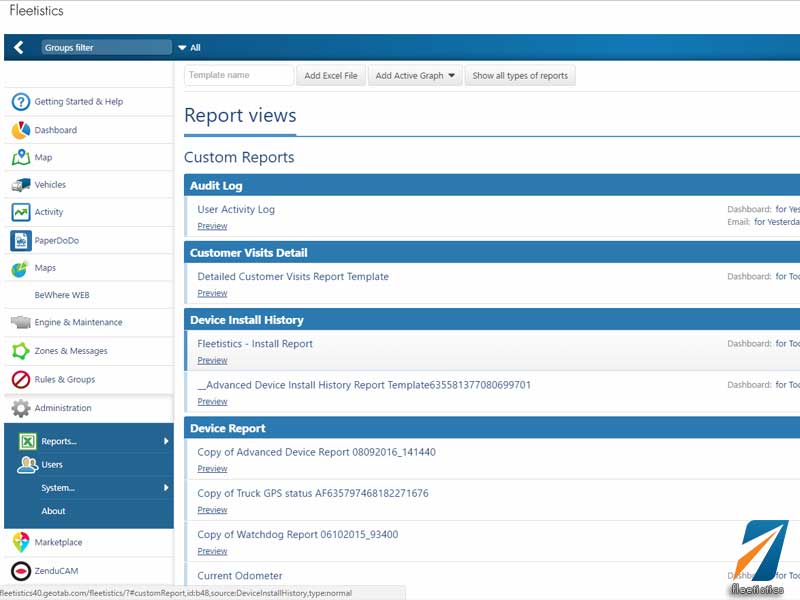
The reports are available in two categories 1. Standard or built-in 2. Custom or customer created. Access to custom reports can be controlled by user groups. This means customers can make one change for hundreds of users.
Fleet Reports Available

Examples of Custom Fleet Reports
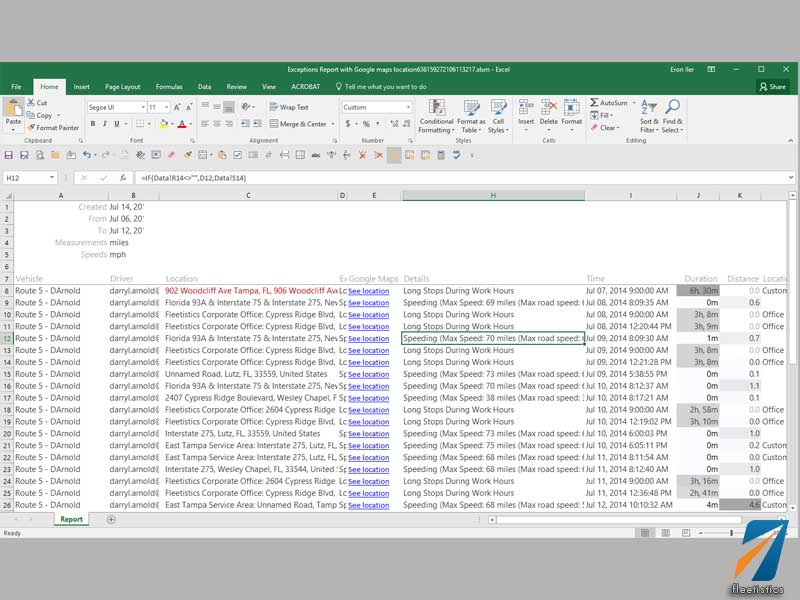
To convert standard reports to a custom report, export it to Excel, edit the formula, save it to your desktop and then upload to your account. When uploading, select the group that will have access to the report. It will then appear in the report list. If custom reports start with a unique prefix, this will group them in the report view making it easy to separate the system from custom reports.
Upload Customized Excel Reports
Customizing reports is a major differentiator between this fleet management system and “canned” GPS tracking systems. If your needs go beyond filtering report fields then the GO System is the only system in the vehicle tracking industry to offer this level of flexibility.
Customizing Reports In Geotab
Step 1. Download a default report.
Step 2. Edit the Excel file and save to your desktop
Step 3. Import the Excel file into Geotab


